
Page 29 - IJPS-3-2
P. 29
Upadhyay AK et al.
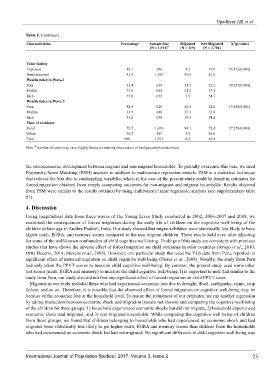
Table 1. Continued.
Characteristics Percentage Sample Size Migrated Not-Migrated X (p-value)
2
(N = 1,913) # (N = 119) (N = 1,794)
Toilet facility
Improved 18.1 346 4.2 19.0 16.512(0.000)
Non-improved 81.9 1,567 95.8 81.0
Wealth index in Wave-1
Poor 33.4 639 51.3 32.2 39.237(0.000)
Middle 33.6 642 41.2 33.1
Rich 33.0 632 7.5 34.7
Wealth index in Wave-3
Poor 32.9 629 45.4 32.0 13.498(0.001)
Middle 33.9 648 35.3 33.8
Rich 33.2 636 19.3 34.2
Place of residence
Rural 73.7 1,410 94.1 72.4 27.279(0.000)
Urban 26.3 503 5.9 26.6
Total 100 1,913 6.2 93.8
Note: number of cases may vary slightly based on missing observation of background characteristics
#
the socioeconomic development between migrant and non-migrant households. To partially overcome this bias, we used
Propensity Score Matching (PSM) analysis in addition to multivariate regression models. PSM is a statistical technique
that reduces the bias due to confounding variables, which in the case of the present study could be found in estimates for
forced migration obtained from simply comparing outcomes for non-migrant and migrant households. Results obtained
from PSM were similar to the results obtained by using multivariate linear regression analysis (see supplementary table
S1).
4. Discussion
Using longitudinal data from three waves of the Young Lives Study conducted in 2002, 2006-2007 and 2009, we
examined the consequences of forced migration during the early life of children on the cognitive well-being of the
children at later age in Andhra Pradesh, India. Our study showed that migrant children were statistically less likely to have
higher math, EGRA, and memory scores compared to the non-migrant children. These results hold even after adjusting
for some of the well-known confounders of child cognitive well-being. Findings of this study are consistent with previous
studies that have shown the adverse effect of forced migration on child outcomes in other countries (Avogo et al., 2010;
Ortiz Becerra, 2014; Stevens et al., 2008). However, one particular study that used the YLS data from Peru, reported no
significant effect of maternal migration on child cognitive well-being (Flores et al., 2009). Notably, the study from Peru
had only taken the PPVT scores to measure child cognitive well-being. By contrast, the present study used some other
test scores (math, EGRA and memory) to measure the child cognitive well-being. It is important to note that similar to the
study from Peru, our study also did not find any significant effect of forced migration on child PPVT score.
Migrants in our study included those who had experienced economic loss due to drought, flood, earthquake, crime, crop
failure, and so on. Therefore, it is possible that the observed effect of forced migration on cognitive well-being may be
because of the economic loss at the household level. To ensure the robustness of our estimates, we ran another regression
by taking interaction between economic shock and migration (results not shown) and comparing the cognitive well-being
of the children for three groups: 1) household experienced economic shocks but did not migrate, 2) household experienced
economic shock and migrated, and 3) non-migrated households. While comparing the cognitive well-being of children
from these groups, we found that children belonging to households who had experienced an economic shock and had
migrated were statistically less likely to get higher math, EGRA and memory scores than children from the households
who had experienced an economic shock but had not migrated. No significant difference in child cognitive well-being was
International Journal of Population Studies | 2017, Volume 3, Issue 2 23