
Page 28 - IJPS-3-2
P. 28
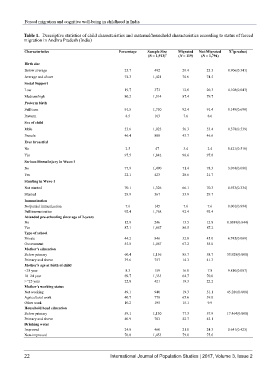
Forced migration and cognitive well-being in childhood in India

           Table 1.  Descriptive statistics of child characteristics and maternal/household characteristics according to status of forced
           migration in Andhra Pradesh (India)

                                                                                                    2
           Characteristics                          Percentage  Sample Size            Migrated       Not-Migrated    X (p-value)
                                                                (N = 1,913) #  (N = 119)  (N = 1,794)
           Birth size
           Below average                              25.7         492         29.4      25.5     0.906(0.341)
           Average and above                          74.3        1,421        70.6      74.5
           Social Support
           Low                                        19.7         373         12.6      20.3     4.108(0.043)
           Medium/high                                80.2        1,514        87.4      79.7
           Preterm birth
           Full term                                  91.5        1,750        92.4      91.4     0.149(0.699)
           Preterm                                     8.5         163         7.6        8.6
           Sex of child
           Male                                       53.6        1,025        56.3      53.4     0.378(0.539)
           Female                                     46.4         888         43.7      46.6
           Ever breastfed
           No                                          2.5         47          3.4        2.4     0.421(0.516)
           Yes                                        97.5        1,842        96.6      97.6
           Serious illness/injury in Wave-1
           No                                         77.9        1,490        71.4      78.3     3.074(0.080)
           Yes                                        22.1         423         28.6      21.7
           Stunting in Wave-1
           Not stunted                                70.1        1,326        66.1      70.3     0.933(0.334)
           Stunted                                    29.9         567         33.9      29.7
           Immunization
           No/partial immunization                     7.6         145         7.6        7.6     0.001(0.994)
           Full immunization                          92.4        1,768        92.4      92.4
           Attended pre-schooling since age of 3-years
           No                                         12.9         246         13.5      12.8     0.0389(0.844)
           Yes                                        87.1        1,667        86.5      87.2
           Type of school
           Private                                    44.2         846         32.8      45.0     6.745(0.009)
           Government                                 55.8        1,067        67.2      55.0
           Mother’s education
           Below primary                              60.4        1,156        85.7      58.7     33.928(0.000)
           Primary and above                          39.6         757         14.3      41.3
           Mother's age at birth of child
           <18 year                                    8.3         159         16.0       7.8     9.810(0.007)
           18–24 year                                 69.7        1,333        64.7      70.0
           >=25 year                                  22.0         421         19.3      22.2
           Mother’s working status
           Not working                                49.1         940         19.3      51.1     45.286(0.000)
           Agricultural work                          40.7         778         65.6      39.0
           Other work                                 10.2         195         15.1       9.9
           Household head education
           Below primary                              59.1        1,130        77.3      57.9     17.464(0.000)
           Primary and above                          40.9         783         22.7      42.1
           Drinking water
           Improved                                   24.0         460         21.0      24.3     0.641(0.423)
           Non-improved                               76.0        1,453        79.0      75.6


           22                                   International Journal of Population Studies | 2017, Volume 3, Issue 2