
Page 26 - IJPS-3-2
P. 26
Forced migration and cognitive well-being in childhood in India
wall, roof and floor) and services (including electricity, drinking water, toilet facility). The lowest 33.3% households were
coded as poor, the next 33.3% as middle, and the remaining 33.3% as rich.
The YLS has also collected information on the main source of drinking water. Children were classified into two
categories according to whether the households they lived in used safe or unsafe water for drinking. Households having
piped water in a dwelling/yard/plot or using a public tap/standpipe or a tube well/borehole or protected dug well were
considered as using safe drinking water. Other households were categorized as using unsafe drinking water. Information
on the type of toilet facility used by the households was also gathered in each of the three waves of the YLS. Improved
toilet facilities included flush toilet/pit latrine connected to a septic tank. Non-improved toilet facilities included public/
shared facility, simple latrine, toilet in a health post or defecating in a/an forest/field/open place (WHO and UNICEF,
2012 update).
2.5 Statistical Methods
Bivariate analysis was performed to compare the characteristics of migrant and non-migrant households using cross
tabulation. Furthermore, a series of multivariate linear regressions were used to examine the effect of forced migration on
child cognitive well-being. Each of the four outcome variables–PPVT score, maths score, EGRA score and memory score
(collected in the third wave)–were regressed on household forced migration (collected in the first wave) and included
all other variables listed in the ‘other variables’. Adjusted coefficients and 95% confidence interval were reported.
To assess whether social support mitigates the effects of forced migration on child cognitive well-being, we used the
recommended procedure (Baron and Kenny, 1986). Variables were included into the multivariate model based on previous
studies and based on their association with cognitive well-being in the bivariate analysis. All the variables were tested
for multicollinearity using variance inflammation factor (VIF) before being included in the regression models. All the
statistical computations were done in STATA 13.0.
3. Results
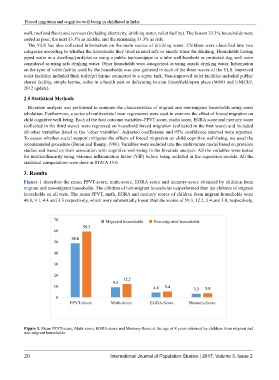
Figure 1 describes the mean PPVT-score, math-score, EGRA-score and memory-score obtained by children from
migrant and non-migrant households. The children of non-migrant households outperformed than the children of migrant
households on all tests. The mean PPVT, math, EGRA and memory scores of children from migrant households were
48.8, 9.1, 4.4 and 3.3 respectively, which were substantially lower than the scores of 59.3, 12.2, 5.4 and 3.8, respectively,
70 Migrated households Non-migrated households
59.3
60
48.8
50
40
30
20
12.2
9.1
10 4.4 5.4 3.3 3.8
0
PPVT-Score Math-Score EGRA-Score Memory-Score
Figure 1. Mean PPVT-score, Math-score, EGRA-score and Memory-Score at the age of 8 years obtained by children from migrant and
non-migrant households
20 International Journal of Population Studies | 2017, Volume 3, Issue 2