
Page 30 - IJPS-3-2
P. 30
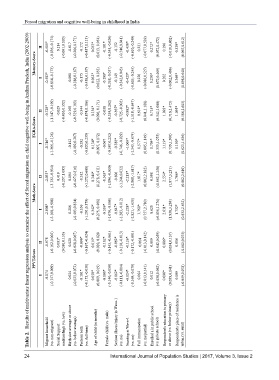
Forced migration and cognitive well-being in childhood in India


             Results of multivariate linear regression analysis to examine the effect of forced migration on child cognitive well-being in Andhra Pradesh, India (2002-2009)

                   II  -0.505*  (-0.836,-0.175)  0.114  (-0.091,0.320)  -0.017  (-0.206,0.171)  -0.172  (-0.457,0.113)  0.033*  (0.013, 0.054)  -0.181*  (-0.343,-0.020)  -0.152  (-0.346,0.041)  -0.430*  (-0.610,-0.249)  0.231  (-0.077,0.539)  0.272*  (0.072,0.472)  0.196  (-0.010,0.402)  0.339*  (0.067,0.612)
                Memory-Score


                   I   -0.503*  (-0.834,-0.173)  -0.001  (-0.188,0.187)  -0.175  (-0.458,0.107)  0.032*  (0.012, 0.053)  -0.198*  (-0.358,-0.037)  -0.149  (-0.342,0.043)  -0.425*  (-0.605,-0.245)  0.220  (-0.086,0.527)  0.270*  (0.072,0.469)  0.202  (-0.002,0.406)  0.369*  (0.098,0.640)


                     -0.728*  (-1.347,-0.109)  -0.029  (-0.410,0.352)  -0.168  (-0.519,0.183)  -0.344  (0.096, 0.171)  -0.038  -0.365*  (-0.725,-0.005)  -0.982*  (-1.318,-0.647)
                   II                 (-0.874,0.186)  0.134*  (-0.339,0.262)  0.614*  (0.041,1.188)  0.715*  (0.342,1.088)  1.093*  (0.710,1.475)  1.095*  (0.586,1.603)
                EGRA-Score


                     -0.746*  (-1.366,-0.126)  -0.142  (-0.492,0.207)  -0.292  (-0.820,0.235)  0.134*  (0.097, 0.172)  -0.067  (-0.367,0.232)  -0.388*  (-0.746,-0.029)  -1.009*  (-1.343,-0.674)  0.577*  (0.005,1.149)  0.704*  (0.333,1.075)  1.119*  (0.739,1.500)  1.130*  (0.623,1.636)
                   I


                   II  -2.033*  (-3.132,-0.934)  0.419  (-0.257,1.095)  0.194  (-0.427,0.816)  -0.332  (-1.272,0.609)  0.344*  (0.278, 0.411)  -0.563*  (-1.096,-0.030)  -0.606  (-1.244,0.032)  -2.213*  (-2.808,-1.617)  1.817*  (0.802,2.832)  0.598  (-0.062,1.258)  2.554*  (1.877,3.231)  1.706*  (0.802,2.610)

                Math-Score


                     -2.008*  (-3.108,-0.908)  0.216  (-0.403,0.834)  -0.356  (-1.291,0.579)  0.342*  (0.275, 0.408)  -0.539*  (-1.070,-0.008)  -0.647*  (-1.283,-0.012)  -2.228*  (-2.821,-1.635)  1.768*  0.620  (-0.036,1.276)  2.611*  1.732*
                   I                                           (0.757,2.780)  (1.938,3.284)  (0.832,2.632)


                   II  -0.078  (-0.162,0.005)  0.081*  (0.030,0.133)  0.020  (-0.028,0.067)  -0.096*  (-0.167,-0.024)  0.015*  (0.010, 0.020  -0.102*  (-0.143,-0.061)  -0.062*  (-0.110,-0.013)  -0.126*  (-0.172,-0.081)  0.064  (-0.013,0.142)  0.009  (-0.042,0.059)  0.086*  (0.034,0.137)  0.006  (-0.062,0.075)
                PPVT-Score


                     -0.074  (-0.157,0.009)  0.024  (-0.023,0.072)  -0.101*  (-0.173,-0.030)  0.010*  (0.009, 0.019)  -0.100*  (-0.140,-0.059)  -0.062*  (-0.111,-0.014)  -0.124*  (-0.169,-0.079)  0.064  (-0.013,0.141)  0.012  (-0.038,0.062)  0.090*  (0.039,0.141)  0.009  (-0.059,0.078)
                   I


             Table 2.   Migrant household   (vs. non-migrant)  Social Support   medium/high (vs. low)  Birth size average or above  (vs. below average)  Preterm birth  (vs. full term)  Age of child (in months)  Female child (vs. male)  Serious illness/injury in Wave-1  (vs. no)  Stunting at Wave-1  (vs. no)  Full immunization  (vs. no/partial)  Enrolled a in public school   (vs. private school)  Respondent's education is primary   or above (vs. below primary)  Respondent'


           24                                   International Journal of Population Studies | 2017, Volume 3, Issue 2