Page 55 - IJPS-3-2
P. 55

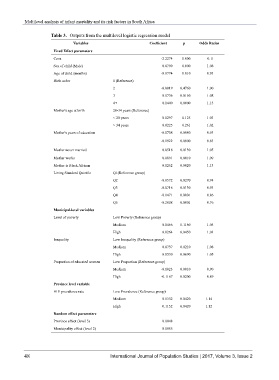
Multilevel analysis of infant mortality and its risk factors in South Africa

                       Table 3.  Outputs from the multilevel logistic regression model

                                Variables                        Coefficient   p       Odds Ratios
                        Fixed Effect parameters
                        Cons                                          -2.2274  0.000        0.11
                        Sex of child (Male)                            0.0790   0.000      1.08
                        Age of child (months)                         -0.0774  0.010       0.93
                        Birth order              1 (Reference)
                                                                     2   -0.0019  0.4760      1.00
                                                                      3   0.0736   0.0150     1.08
                                                                      4+   0.1440   0.0000     1.15
                        Mother's age at birth    20-34 years (Reference)
                                                                      < 20 years   0.0297   0.125     1.03
                                                                      > 34 years   0.0225   0.261     1.02
                        Mother's years of education                   -0.0708  0.0080      0.93

                                                                      -0.1922  0.0000      0.83
                        Mother never married                          0.0518    0.0130      1.05
                        Mother works                                  0.0891   0.0010      1.09
                        Mother is Black African                       0.1252   0.0020      1.13
                        Living Standard Quintile  Q1(Reference group)
                                                                      Q2   -0.0572  0.0270      0.94
                                                                      Q3   -0.0716  0.0130      0.93
                                                                      Q4   -0.1471  0.0001     0.86
                                                                      Q5   -0.2808  0.0001       0.76
                        Municipal-level variables
                        Level of poverty         Low Poverty (Reference group)
                                                                     Medium    0.0466   0.1160      1.05
                                                                     High   0.0264   0.0450      1.03
                        Inequality               Low Inequality (Reference group)
                                                                     Medium    0.0737   0.0210      1.08
                                                                      High   0.0530   0.0690      1.05
                        Proportion of educated women  Low Proportion (Reference group)
                                                                     Medium   -0.1023  0.0010      0.90
                                                                     High   -0.1167  0.0200      0.89
                        Province level variable
                        HIV prevalence rate      Low Prevalence (Reference group)
                                                                     Medium   0.1352  0.0420  1.14
                                                                     High   0.1152   0.0420   1.12
                        Random effect parameters
                        Province effect (level 3)                     0.0048
                        Municipality effect (level 2)                 0.0085


           48                                   International Journal of Population Studies | 2017, Volume 3, Issue 2
   50   51   52   53   54   55   56   57   58   59   60