
Page 54 - IJPS-3-2
P. 54
Zewdie S A and Adjiwanou V
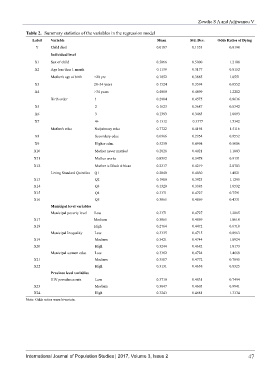
Table 2. Summary statistics of the variables in the regression model
Label Variable Mean Std. Dev. Odds Ratios of Dying
Y Child died 0.0187 0.1353 0.0190
Individual level
X1 Sex of child 0.5066 0.5000 1.2108
X2 Age less than 1 month 0.1139 0.3177 0.8152
Mother's age at birth <20 yrs 0.1852 0.3885 1.0551
X3 20–34 years 0.1524 0.3594 0.8552
X4 >34 years 0.4000 0.4899 1.2212
Birth order 1 0.2984 0.4575 0.8636
X5 2 0.1623 0.3687 0.8342
X6 3 0.1393 0.3463 1.0893
X7 4+ 0.1312 0.3377 1.5342
Mother's educ No/primary educ 0.7722 0.4194 1.5116
X8 Secondary educ 0.0966 0.2954 0.9552
X9 Higher educ 0.5250 0.4994 0.5006
X10 Mother never married 0.2028 0.4021 1.1803
X11 Mother works 0.8592 0.3478 0.9151
X12 Mother is Black African 0.2317 0.4219 2.0703
Living Standard Quintiles Q1 0.2040 0.4030 1.4821
X13 Q2 0.1900 0.3923 1.1295
X14 Q3 0.1320 0.3385 1.0532
X15 Q4 0.3371 0.4727 0.7591
X16 Q5 0.3865 0.4869 0.4331
Municipal level variables
Municipal poverty level Low 0.3371 0.4727 1.2865
X17 Medium 0.3865 0.4869 1.0610
X18 High 0.2764 0.4472 0.6718
Municipal Inequality Low 0.3335 0.4715 0.8963
X19 Medium 0.3421 0.4744 1.0924
X20 High 0.3244 0.4682 1.0173
Municipal women educ Low 0.3362 0.4724 1.4668
X21 Medium 0.3507 0.4772 0.7895
X22 High 0.3131 0.4638 0.8325
Province level variables
HIV prevalence rate Low 0.3710 0.4831 0.7494
X23 Medium 0.3047 0.4603 0.9941
X24 High 0.3243 0.4681 1.3334
Note: Odds ratios were bivariate.
International Journal of Population Studies | 2017, Volume 3, Issue 2 47