
Page 52 - IJPS-3-2
P. 52
Zewdie S A and Adjiwanou V
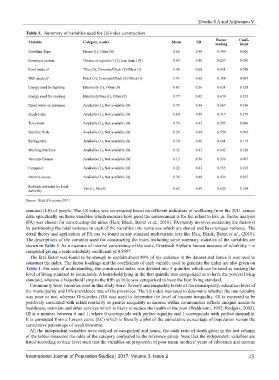
Table 1. Summary of variables used for LS index construction
Factor
Variable Category (code) Mean SD loading Coeff-
icient
Dwelling Type House (1), Other (0) 0.66 0.48 0.384 0.066
Room per person Greater or equal to 1 (1), less than 1 (0) 0.69 0.46 0.257 0.030
Roof made of Tiles (3), Concrete/Block (2) Other (1) 1.98 0.66 0.431 0.058
Wall made of Brick (3), Concrete/Block (2) Other (1) 1.93 0.60 0.388 0.067
Energy used for lighting Electricity (1), Other (0) 0.85 0.36 0.631 0.128
Energy used for cooking Electricity/Gas (1), Other (0) 0.77 0.42 0.674 0.123
Piped water on premises Available (1), Not available (0) 0.73 0.44 0.667 0.106
Flush Toilet Available (1), Not available (0) 0.60 0.49 0.717 0.179
Television Available (1), Not available (0) 0.76 0.43 0.595 0.096
Satellite Dish Available (1), Not available (0) 0.26 0.44 0.554 0.092
Refrigerator Available (1), Not available (0) 0.70 0.46 0.641 0.118
Washing Machine Available (1), Not available (0) 0.32 0.47 0.645 0.120
Vacuum Cleaner Available (1), Not available (0) 0.17 0.38 0.536 0.097
Computer Available (1), Not available (0) 0.22 0.41 0.555 0.105
Internet access Available (1), Not available (0) 0.36 0.48 0.436 0.057
Rubbish collected by local Yes (1), No (0) 0.62 0.49 0.625 0.104
authority
Source: Stats SA census 2011
standard (LS) of people. The LS index was constructed based on different indicators of wellbeing from the 2011 census
data, specifically on those variables which measure how good the environment is for the infant to live in. Factor analysis
(FA) was chosen for constructing the index (Hair, Black, Babin et al., 2010). FA mainly involves extracting the factor(s)
by partitioning the total variance in each of the variables into variances which are shared and have unique variance. The
detail theory and application of FA can be found in any standard multivariate text like Hair, Black, Babin et al., (2010).
The descriptions of the variables used for constructing the index including some summary statistics of the variables are
shown in Table 1. As a measure of internal consistency of the scale, Cronbach Alpha–a known measure of reliability – is
computed giving a scale reliability coefficient of 0.8597.
The first factor was found to be enough to explain about 80% of the variance in the dataset and hence it was used to
construct the index. The factor loadings and the coefficients of each variable used to generate the index are also given on
Table 1. For ease of understanding, the constructed index was divided into 5 quintiles which can be used as ranking the
level of living standard to households. A household lying in the first quintile was categorised as to have the poorest living
standard, whereas a household lying in the fifth quintile was categorised to have the best living standard.
Community level variables used in this study were: Poverty and inequality levels of the municipality; education level of
the municipality and HIV-prevalence rate of the provinces. The LS index was used to determine whether the municipality
was poor or not, whereas Gini-index (GI) was used to determine the level of income inequality. GI is expected to be
positively correlated with infant mortality as greater inequality in income within communities reflects unequal access to
healthcare, nutrition and other services which is likely to reduce the health of the poor (Waldmann, 1992; Rodgers, 2002).
GI is a number between 0 and 1, where 0 corresponds with perfect equality and 1 corresponds with perfect inequality.
It is computed from a Lorenz curve (LC) which is literally a plot of the cumulative percentage of population versus the
cumulative percentage of wealth/income.
All the independent variables were defined as categorical and hence, the odds ratio of death given in the last column
of the tables measures the odds of the category compared to the reference group. Note that the independent variables are
listed according to their level such that the variables on proportion of poor mean mothers’ years of education and income
International Journal of Population Studies | 2017, Volume 3, Issue 2 45