
Page 57 - IJPS-3-2
P. 57
Multilevel analysis of infant mortality and its risk factors in South Africa
-1.5
Predicted log-odds -2 -2.5
-3
Western Cape Eastern Cape Northern Cape Free State KwaZulu-Natal North West Gauteng Mpumalanga Limpopo
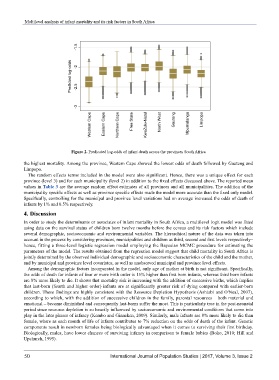
Figure 2. Predicated log-odds of infant death across the provinces South Africa
the highest mortality. Among the province, Western Cape showed the lowest odds of death followed by Gauteng and
Limpopo.
The random effects terms included in the model were also significant. Hence, there was a unique effect for each
province (level 3) and for each municipality (level 2) in addition to the fixed effects discussed above. The reported mean
values in Table 3 are the average random effect estimates of all provinces and all municipalities. The addition of the
municipality specific effects as well as province specific effects made the model more accurate than the fixed only model.
Specifically, controlling for the municipal and province level variations had on average increased the odds of death of
infants by 1% and 0.5% respectively.
4. Discussion
In order to study the determinants or associates of infant mortality in South Africa, a multilevel logit model was fitted
using data on the survival status of children born twelve months before the census and its risk factors which include
several demographic, socioeconomic and environmental variables. The hierarchical nature of the data was taken into
account in the process by considering provinces, municipalities and children as third, second and first levels respectively–
hence, fitting a three-level logistic regression model employing the Bayesian MCMC procedure for estimating the
parameters of the model. The results obtained from the regression model suggest that child mortality in South Africa is
jointly determined by the observed individual demographic and socioeconomic characteristics of the child and the mother,
and by municipal and province level covariates, as well as unobserved municipal and province level effects.
Among the demographic factors incorporated in the model, only age of mother at birth is not significant. Specifically,
the odds of death for infants of four or more birth order is 15% higher than first born infants, whereas third born infants
are 8% more likely to die. It shows that mortality risk is increasing with the addition of successive births, which implies
that last-born (fourth and higher order) infants are at significantly greater risk of dying compared with earlier-born
children. These findings are highly consistent with the Resource Depletion Hypothesis (Ashiabi and O'Neal, 2007),
according to which, with the addition of successive children in the family, parental resources – both material and
emotional – become diminished and consequently last-borns suffer the most. This is particularly true in the post-neonatal
period since resource depletion is so heavily influenced by socioeconomic and environmental conditions that come into
play in the later phases of infancy (Kembo and Ginneken, 2009). Similarly, male infants are 8% more likely to die than
female, where as each month of life of infants contributes to 7% reduction on the odds of death of the infant. Genetic
components result in newborn females being biologically advantaged when it comes to surviving their first birthday.
Biologically, males, have lower chances of surviving infancy in comparison to female babies (Boko, 2010; Hill and
Upchurch, 1995).
50 International Journal of Population Studies | 2017, Volume 3, Issue 2