
Page 23 - IJPS-5-1
P. 23
Gu and Feng
We propose that an ACAR ranging from 0.97 to 1.03 indicates a strong consistency in the digit preference/avoidance
at the ending digit, a ratio of 0.95-0.97 or 1.03-1.05 indicates a mild digit preference/avoidance, a ratio lower than 0.95 or
higher than 1.05 indicates a moderate digit preference/avoidance, and a ratio lower than 0.90 or higher than 1.10 indicates
a severe digit preference/avoidance. For a ratio lower than 0.85 or higher than 1.15, it is necessary to adjust and correct
the raw data.
When the number of births of the original cohorts is available, and the quality is good, the ACAR is likely more robust
and accurate in identifying age heaping compared with the conventional and modified Whipple’s Indexes and the Myers’
Index that are based on either a single time point of data or one census. Similar to that for APAR, we could also sum the
deviation from one for each ending digit for a general description of age heaping across all ending digits, namely, the Total
Cohort Age Concentration Index (ToPACI):
9
∑ 2 (7)
ToCACI = 100* ( ACAR i −1() ).
i=0
The criterion of ToCACI is the same as that of ToPACI.
3. Empirical Validation
The methodology used for calculating APAR is similar to that used for the (modified) Whipple’s Index. The difference
between these two methods is that APAR calculates age ratio first for a specific age from population counts of its
neighboring ages and then averages the ratios for ages with the same ending digit, while the modified Whipple’s Index
sums population counts first for the same ending digit of ages and then divides by the total population counts of their
neighboring ages (for details see Spoorenberg, 2007).
For a stable or a stationary population, mathematically, it can be proved that these two methods produce identical results.
In reality, when they are applied to Japan and Sweden, the two countries with the highest data quality of population counts
in the world (Thatcher, Kanisto, and Vaupel, 1998), these two methods also produce very close results (Appendix Table A)
that compare the APAR method with the modified Whipple’s Index for the preferences over ending digits of age for years
from 1980 to 2015. These data are obtained from the Human Mortality Database (HMD), which are mainly from censuses
and vital registration of these countries (Wilmoth, Andreev, Jdanov et al., 2017).
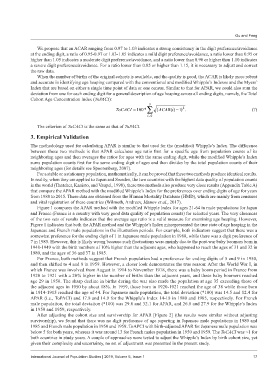
Figure 1 compares the APAR method with the modified Whipple Index for ages 21-64 in male populations for Japan
and France (France is a country with very good data quality of population counts) for selected years. The very closeness
of the two sets of results indicates that the average age ratio is a valid measure for examining age heaping. However,
Figure 1 indicates that both the APAR method and the Whipple’s Index misrepresented the true state of age heaping in the
Japanese and French male populations in the illustration periods. For example, both indicators suggest that there was a
somewhat preference for the ending digit of 1 in Japanese male population in 1980, while there was a digit preference of
7 in 1985. However, this is likely wrong because such fluctuations were mainly due to the post-war baby boomers born in
1948-1949 with the birth numbers of 10% higher than the adjacent ages, who happened to reach the ages of 31 and 32 in
1980, and the ages of 36 and 37 in 1985.
For France, both methods suggest that French population had a preference for ending digits of 5 and 9 in 1950,
and then shifted to 4 and 8 in 1959. However, a closer look demonstrates the true reason: After the World War I, in
which France was involved from August in 1914 to November 1918, there was a baby boom period in France from
1920 to 1921 with a 20% higher in the number of births than the adjacent years, and these baby boomers reached
age 29 in 1950. The sharp decline in births during the war also made the population at age 35 exceeding those of
the adjacent ages in 1950 by about 18%. In 1959, those born in 1920-1921 reached the age of 38 while those born
in 1914-1915 reached the age of 44. For Japanese male population, the total deviation (*100) was 14.5 and 12.4 for
APAR (i.e., ToPACI) and 17.8 and 14.9 for the Whipple’s Index 14-18 in 1980 and 1985, respectively. For French
male population, the total deviation (*100) was 29.8 and 32.1 for APAR, and 26.8 and 27.9 for the Whipple’s Index
in 1950 and 1959, respectively.
After adjusting the cohort size and survivorship for APAR [Figure 2] (the results were similar without adjusting
survivorship), we found that there was no digit preference of age reporting in Japanese male populations in 1980 and
1985 and French male population in 1950 and 1959. ToAPCI with birth-adjusted APAR for Japanese male population was
below 5 for both years, whereas it was around 13 for French males population in 1950 and 1959. The ToCACI was <1 for
both countries in study years. A couple of approaches were tested to adjust the Whipple’s Index by birth cohort size, yet
given their complexity and uncertainty, no set of adjustment was presented in the present study.
International Journal of Population Studies | 2019, Volume 5, Issue 1 17