
Page 25 - IJPS-5-1
P. 25
Gu and Feng
there was generally no preference on the ending digits of age in the age range of 21-64. No significant age heaping was
found in the age ranges 21-64. For earlier censuses, since we do not have the number of births in the 1920s and 1930s in
China, we are not able to present birth-adjusted APAR in these censuses.
No preference on an ending digit of age does not mean no preference on some specific ages, which we indeed observed
in certain censuses. Figure 7 illustrates age ratios for the age range of 20-80 in multiple censuses, and Figure 8 shows the
cohort age ratios at different ages based on a comparison of the same cohorts in these censuses. Altogether, in the 1953 and
1964 censuses, we find out some mild preference on the ages 40, 50, 60, 70, and 80 years old. For example, in Figure 7, the
age ratios at ages of 40, 50, 60, 70, and 80 were all above 1.03: These ages hold at least 3% more of population numbers
than the adjacent ages. In contrast, age ratios at the adjacent ages were all below 1. Although there were wars and social
riots in China from 1870 to 1900, most of them were small-scaled, and thus the cohort born in 1870 to 1900 could be
considered as rather stable. At the same time, because the mortality rate was relatively high before 1950 (Lee and Wang,
1999; Seifert, 1935), the difference in the number of births between adjacent cohorts is likely minor and could be ignored
after certain ages in adulthood. Therefore, if there was no preference on ages, the age ratios at ages of 50, 60, 70, or 80 are
supposed to be very close to one. According to Figure 7, in 1964, the cohort age ratios at 61 and 71 were all <1. This also
proves that the first census of China had somewhat age heaping at the ages of 60 and 70.
With social development, the age preference on the ages of 40 and 50 generally disappeared after 1982. In the recent
three censuses of 1990, 2000, and 2010, however, the preference on age 60, 70 and particularly 80 was still observable
in these ages. For example, in the 2000 census, the age ratios at 70 and 80 were more than 1.05. In the 2010 census,
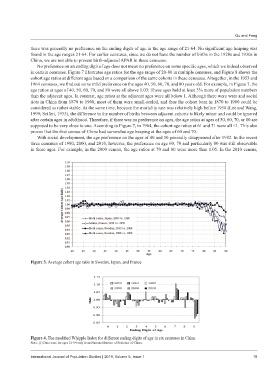
Figure 3. Average cohort age ratio in Sweden, Japan, and France
Figure 4. The modified Whipple Index for different ending digits of age in six censuses in China
Note: (1) Data were for ages 21-64 only from National Bureau of Statistics of China.
International Journal of Population Studies | 2019, Volume 5, Issue 1 19