
Page 24 - IJPS-5-1
P. 24
Average age ratio method and age heaping in Chinese censuses
Figure 3 further presents ACAR for Sweden, France, and Japan for ages 20-90, rather than for the classic age range
of 23-62 for Whipple Index or the age range of 21-64 for the modified Whipple’s Index. Clearly, between the age of
20 and 80 years, ACAR at each age was very close to 1 (0.99-1.01) for the three countries. After age 80, the ratio at
each age declined rapidly due to the high mortality rates. These results indicate that there is no age preference in these
three countries and that the age range for calculating APAR and ACAR can go beyond normal adulthood as used for the
Whipple’s Index.
4. Results of Examination on the Chinese Censuses
Our examination of age heaping in the Chinese censuses focuses on the age range from 10 to 80 years old, rather than
from age 0 to age 89 years. This is because mortality underestimation for young children aged 0-5 years and mortality
underestimation for the oldest-old population are different from other ages (Guo, Yin, Wang, et al., 2015). In other words,
the age range to be studied in a given census in the present study is from 20 to 80 years, and the age range in its previous
census is correspondingly from 10 to 70 years. In addition, when comparing the census data for 2000 versus 1990, we
converted the 2000 census data (November 1) to mid-year data by assuming that the population is evenly distributed
across months within a given calendar year.
Figure 4 reveals the modified Whipple Index at each ending digit of age calculated based on the age range of 21-64
each census. The results point out that in the recent three censuses, there seemed to exist a preference on the ending digit
of 7 and avoidance on 9. However, this conclusion is not correct as there were a larger number of babies born in 1963-
1964, resulted from a baby boom after the feminine in 1959-1961., the cohort born in 1963-1964 aged 27, 37, and 47 years
in the 1990, 2000, and 2010 censuses, respectively. Hence, the age heaping on the ending digit of 7 should not indicate
an age digit preference as proposed by some scholars (Wu and Gan, 2013), but a result of different sizes of birth cohorts.
Figure 5 presents the birth-adjusted APAR for the 2000 and 2010 censuses in comparison to the modified Whipple’s
Index. The comparison shows that the preference revealed by the modified Whipple’s Index on digits 2 and 7 found in
2000 and on digits 2, 7, and 8 in 2010 and that the avoidance in digits 1, 8, and 9 in 2000 and 9 in 2010 were indeed due
to different size of the original birth cohorts. Figure 6 illustrates ACAR for ending digits of age, clearly suggesting that
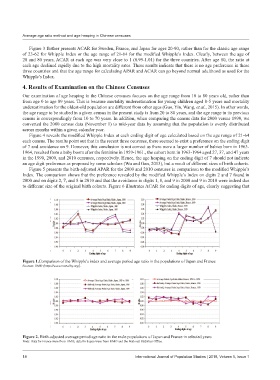
Figure 1.Comparison of the Whipple’s index and average period age ratio in the populations of Japan and France
Sources: HMD (https://www.mortality.org/).
Figure 2. Birth-adjusted average period age ratio in the male populations of Japan and France in selected years
Note: Data for France were from HMD; data for Japan were from HMD and the National Statistics Office.
18 International Journal of Population Studies | 2019, Volume 5, Issue 1