
Page 26 - IJPS-5-1
P. 26
Average age ratio method and age heaping in Chinese censuses
Figure 5. The modified Whipple Index and the birth-adjusted APAR, ages 21-64, China, 2000 and 2010 censuses
Note: Data were from the National Bureau of Statistics of China
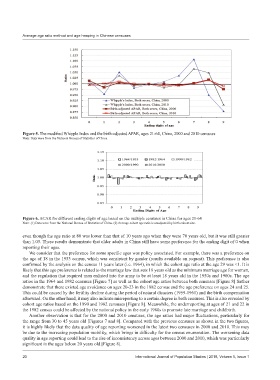
Figure 6. ACAR for different ending digits of age based on the multiple censuses in China for ages 21-64
Note: (1) Data were from the National Bureau of Statistics of China. (2) Average cohort age ratio is unadjusted by birth cohort size.
even though the age ratio at 80 was lower than that of 10 years ago when they were 70 years old, but it was still greater
than 1.05. These results demonstrate that older adults in China still have some preference for the ending digit of 0 when
reporting their ages.
We consider that the preference for some specific ages was policy associated. For example, there was a preference on
the age of 18 in the 1953 census, which was consistent by gender (results available on request). This preference is also
confirmed by the analysis on the census 11 years later (i.e. 1964), in which the cohort age ratio at the age 29 was <1. It is
likely that this age preference is related to the marriage law that sets 18 years old as the minimum marriage age for women,
and the regulation that required men enlisted into the army to be at least 18 years old in the 1950s and 1960s. The age
ratios in the 1964 and 1982 censuses [Figure 7] as well as the cohort age ratios between both censuses [Figure 8] further
demonstrate that there existed age avoidance on ages 20-23 in the 1982 census and the age preference on ages 24 and 25.
This could be caused by the fertility decline during the period of natural disasters (1959-1961) and the birth compensation
afterward. On the other hand, it may also indicate misreporting to a certain degree in both censuses. This is also revealed by
cohort age ratios based on the 1990 and 1982 censuses [Figure 8]. Meanwhile, the underreporting at ages of 21 and 22 in
the 1982 census could be affected by the national policy in the early 1980s to promote late marriage and childbirth.
Another observation is that for the 2000 and 2010 censuses, the age ratios had major fluctuations, particularly for
the range from 30 to 45 years old [Figures 7 and 8]. Compared with the previous censuses as shown in the two figures,
it is highly likely that the data quality of age reporting worsened in the latest two censuses in 2000 and 2010. This may
be due to the increasing population mobility, which brings in difficulty for the census enumeration. The worsening data
quality in age reporting could lead to the rise of inconsistency across ages between 2000 and 2010, which was particularly
significant in the ages below 20 years old [Figure 8].
20 International Journal of Population Studies | 2019, Volume 5, Issue 1