
Page 39 - IJPS-5-1
P. 39
Wai M M, et al.
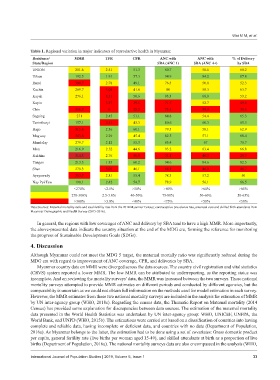
Table 1. Regional variation in major indicators of reproductive health in Myanmar.
Residence/ MMR TFR CPR ANC with ANC with % of Delivery
State/Region SBA (ANC 1) SBA (ANC 4+) by SBA
UNION 281.6 2.51 51.3 80.7 58.6 60.2
Urban 192.5 1.91 57.3 94.9 84.2 87.8
Rural 309.7 2.78 49.1 76.5 50.8 52.3
Kachin 269.7 3.04 41.6 80 58.3 63.7
Kayah 276.1 3.51 50.6 93.3 68.8 53.2
Kayin 3.37 39.5 71.7 52.7 49.6
Chin 356.7 5 25.2 73.5 39.9 35.6
Sagaing 271 2.45 51.1 84.8 54.4 65.3
Tanintharyi 157.1 3.31 43.3 80.6 60.3 65.3
Bago 315.6 2.36 60.1 79.5 58.1 62.9
Magway 343.6 2.29 45.4 82.5 57.1 68.4
Mandalay 279.7 2.12 55.3 85.4 67 78.7
Mon 216.9 2.52 44.6 93.2 63.4 66.8
Rakhine 314.3 2.76 36.9 71.1 40.3 29.7
Yangon 213.3 1.85 60.2 94.6 84.6 82.5
Shan 278.3 3.07 46.1 68.1 46.9 46.7
Ayeyawady 353.7 2.81 55.4 78.3 57.2 50
Nay Pyi Taw 198.1 2.42 54.7 78.9 56.1 66.5
<270% <2.5% >50% >80% >60% >65%
270-300% 2.5-3.0% 40-50% 75-80% 50-60% 50-65%
>300% >3.0% <40% <75% <50% <50%
Data Sources: Maternal mortality ratio and total fertility rate from the 2014 Myanmar Census; contraceptive prevalence rate, antenatal care and skilled birth attendants from
Myanmar Demographic and Health Survey (2015-2016).
In general, the regions with low coverages of ANC and delivery by SBA tend to have a high MMR. More importantly,
the above-presented data indicate the country situation at the end of the MDG era, forming the reference for monitoring
the progress of Sustainable Development Goals (SDGs).
4. Discussion
Although Myanmar could not meet the MDG 5 target, the maternal mortally ratio was significantly reduced during the
MDG era with regard to improvement of ANC coverage, CPR, and deliveries by SBA.
Myanmar country data on MMR were diverged across the data sources. The country civil registration and vital statistics
(CRVS) system reported a lower MMR. The low MMR can be attributed to underreporting, as the reporting status was
incomplete. And on reviewing the mortality surveys’ data, the MMR was increased between the two surveys. These national
mortality surveys attempted to provide MMR estimates on different periods and conducted by different agencies, but the
comparability is uncertain as we could not obtain full information on the methods used for model estimation in each survey.
However, the MMR estimates from these two national mortality surveys are included in the analysis for estimation of MMR
by UN inter-agency group (WHO, 2018c). Regarding the census data, the Thematic Report on Maternal mortality (2014
Census) has provided some explanation for discrepancies between data sources. The estimation of the maternal mortality
data presented in the World Health Statistics was undertaken by UN inter-agency group: WHO, UNICEF, UNFPA, the
World Bank, and UNPD (WHO, 2015b). The estimations were carried out based on a classification of countries into having
complete and reliable data, having incomplete or deficient data, and countries with no data (Department of Population,
2016a). As Myanmar belongs to the latter, the estimation had to be done using a set of covariates: Gross domestic product
per capita, general fertility rate (live births per woman aged 15-49), and skilled attendants at birth as a proportion of live
births (Department of Population, 2016a). The national mortality surveys data are also encompassed in the analysis (WHO,
International Journal of Population Studies | 2019, Volume 5, Issue 1 33