
Page 36 - IJPS-5-1
P. 36
Maternal mortality and fertility in Myanmar
incorporated these data in the estimation process (WHO, 2018c). The regression analysis showed that the MMR was
significantly reduced by 9.1 maternal deaths/100,000 live births/year (95%CI: 4.0-14.1). Despite a reduction in MMR to
reach 178/100,000 live births (uncertainty interval 121-284) in 2015, Myanmar failed to meet the MDG 5 target set at
113/100,000 live births (WHO-SEARO, 2016; WHO, 2015b).
The cause-specific maternal mortality survey conducted in 2005 reported the main causes of maternal deaths in
Myanmar as postpartum hemorrhage 31%, hypertensive disorders of pregnancy, including eclampsia 17%, and abortion-
related mortality 10% (WHO-Myanmar, 2014). Similarly, a maternal death review in 2013 reported that 38% of maternal
deaths were due to postpartum hemorrhage, followed by pregnancy-induced hypertension 21% and abortion 12%
(Maternal and Reproductive Health Division, 2014). Majority of these maternal deaths can be prevented by proper care
during pregnancy and delivery by a skilled professional, and by timely management and referral.
3.1.1. Care during pregnancy
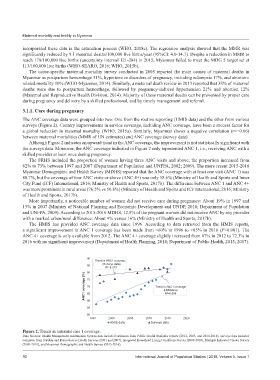
The ANC coverage data were grouped into two: One from the routine reporting (HMIS data) and the other from various
surveys (Figure 2). Country improvements in service coverage, including ANC coverage, have been a success factor for
a global reduction in maternal mortality (WHO, 2015a). Similarly, Myanmar shows a negative correlation (r=−0.66)
between maternal mortalities (MMR of UN estimates) and ANC coverage (survey data).
Although Figure 2 indicates an upward trend in the ANC coverage, the improvement is not statistically significant with
the surveys data. Moreover, the ANC coverage indicated in Figure 2 only represented ANC 1, i.e., receiving ANC with a
skilled provider at least once during pregnancy.
The FRHS included the proportion of women having three ANC visits and above; the proportion increased from
62% to 73% between 1997 and 2007 (Department of Population and UNFPA, 2002; 2009). The more recent 2015-2016
Myanmar Demographic and Health Survey (MDHS) reported that the ANC coverage with at least one visit (ANC 1) was
80.7%, but the coverage of four ANC visits or above (ANC 4+) was only 58.6% (Ministry of Health and Sports and Inner
City Fund (ICF) International, 2016; Ministry of Health and Sports, 2017b). The difference between ANC 1 and ANC 4+
was more prominent in rural areas (76.5% vs 50.8%) (Ministry of Health and Sports and ICF International, 2016; Ministry
of Health and Sports, 2017b).
More importantly, a noticeable number of women did not receive care during pregnancy: About 19% in 1997 and
13% in 2007 (Ministry of National Planning and Economic Development and UNDP, 2010; Department of Population
and UNFPA, 2009). According to 2015-2016 MDHS, 12.8% of the pregnant women did not receive ANC by any provider
with a marked urban/rural difference: About 4% versus 16% (Ministry of Health and Sports, 2017b).
The HMIS has provided ANC coverage data since 1996. According to data retrieved from the HMIS reports,
a significant improvement in ANC 1 coverage has been made from <60% in 1996 to >85% in 2016 (P<0.001). The
ANC 4+ coverage is only available from 2012. The ANC 4+ coverage slightly increased from 67% in 2012 to 72.3% in
2016 with no significant improvement (Department of Health Planning, 2014; Department of Public Health, 2015; 2017).
90
Trend in ANC1 coverage
85 (Surveys data)
R 2 =0.373
80
ANC1 coverage (%) 75 Trend in ANC1 coverage
70
(HMISdata)
65
R 2 =0.606
60
55
50
1995 2000 2005 2010 2015 2020
HMIS data Surveys data
Figure 2. Trends in antenatal care 1 coverage.
Data Sources: Health Management Information System data included estimates from Public Health Statistics reports (2012, 2013, and 2014-2016); surveys data included
estimates from Fertility and Reproductive Health Surveys (2001 and 2007), Integrated Household Living Conditions Survey (2009-2010), Multiple Indicator Cluster Survey
(2009-2010), and Myanmar Demographic and Health Survey (2015-2016).
30 International Journal of Population Studies | 2019, Volume 5, Issue 1