
Page 32 - IJPS-5-1
P. 32
Average age ratio method and age heaping in Chinese censuses
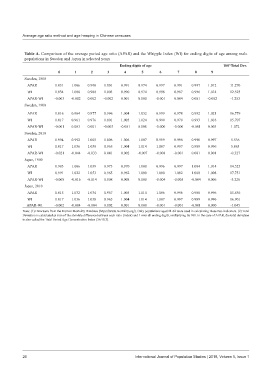
Table A. Comparison of the average period age ratio (APAR) and the Whipple Index (WI) for ending digits of age among male
populations in Sweden and Japan in selected years
Ending digits of age 100*Total Dev.
0 1 2 3 4 5 6 7 8 9
Sweden, 1800
APAR 1.031 1.006 0.990 1.001 0.991 0.974 0.997 0.991 0.997 1.012 11.270
WI 1.034 1.008 0.988 1.003 0.990 0.974 0.998 0.987 0.996 1.014 12.523
APAR-WI -0.003 -0.002 0.002 -0.002 0.001 0.000 -0.001 0.004 0.001 -0.002 -1.253
Sweden, 1900
APAR 1.016 0.964 0.977 0.996 1.004 1.032 0.999 0.978 0.992 1.021 16.779
WI 1.017 0.961 0.976 1.001 1.005 1.024 0.999 0.978 0.993 1.018 15.707
APAR-WI -0.001 0.003 0.001 -0.005 -0.001 0.008 -0.000 -0.000 -0.001 0.003 1.072
Sweden, 2010
APAR 0.994 0.992 1.005 1.006 1.006 1.007 0.999 0.996 0.990 0.997 5.536
WI 1.017 1.036 1.038 0.965 1.004 1.014 1.007 0.997 0.989 0.996 5.863
APAR-WI -0.021 -0.044 -0.033 0.041 0.002 -0.007 -0.008 -0.001 0.001 0.001 -0.327
Japan, 1960
APAR 0.983 1.006 1.039 0.973 0.970 1.000 0.996 0.997 1.004 1.014 14.525
WI 0.991 1.022 1.053 0.965 0.962 1.000 1.000 1.002 1.008 1.008 17.751
APAR-WI -0.008 -0.016 -0.014 0.008 0.008 0.000 -0.004 -0.005 -0.004 0.006 -3.226
Japan, 2010
APAR 1.015 1.032 1.034 0.967 1.005 1.014 1.006 0.996 0.988 0.996 15.856
WI 1.017 1.036 1.038 0.965 1.004 1.014 1.007 0.997 0.989 0.996 16.901
APAR-WI -0.002 -0.004 -0.004 0.002 0.001 0.000 -0.001 -0.001 -0.001 0.000 -1.045
Note: (1) Data were from the Human Mortality Database (https://www.mortality.org/). Only populations aged 21-64 were used in calculating these two indicators. (2) Total
Deviation is calculated as sum of the absolute difference between each ratio (Index) and 1 over all ending digits, multiplying by 100. In the case of APAR, the total deviation
is also called the Total Period Age Concentration Index (ToPACI).
26 International Journal of Population Studies | 2019, Volume 5, Issue 1