
Page 35 - IJPS-5-1
P. 35
Wai M M, et al.
Household Living Condition Assessment (IHLCA) I and II (2005 and 2010) by UNDP and Multiple Indicators Cluster
Survey (MICS 2009-2010) by UNICEF. A series of public health statistics reports (2012-2016) of MOHS that provide
data from the routine reporting system (HMIS) of the ministry were also used to estimate these indicators.
Finally, the most recent estimates of all these indicators are compiled from the 2014 Myanmar Census (from the
Department of Population website) and the Myanmar Demographic and Health Survey 2015-2016 (from the MOHS
web page).
To obtain a comprehensive overview of the trend of each indicator, a trend analysis was applied for each indicator, and
the statistical significance of the progress was shown with regression analysis (at 95% confidence interval). Correlation
between the impact indicators and the service coverage indicators was also tested.
3. Findings
3.1. Maternal Mortality
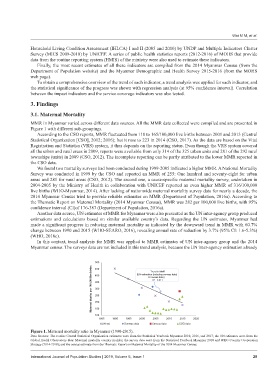
MMR in Myanmar varied across different data sources. All the MMR data collected were compiled and are presented in
Figure 1 with different sub-groupings.
According to the CSO reports, MMR fluctuated from 110 to 165/100,000 live births between 2001 and 2013 (Central
Statistical Organization [CSO], 2012; 2016); but it rose to 223 in 2014 (CSO, 2017). As the data are based on the Vital
Registration and Statistics (VRS) system, it thus depends on the reporting status. Even though the VRS system covered
all the urban and rural areas in 2009, reports were available from only 314 of the 325 urban units and 281 of the 292 rural
townships (units) in 2009 (CSO, 2012). The incomplete reporting can be partly attributed to the lower MMR reported in
the CSO data.
We found two mortality surveys had been conducted during 1999-2005 indicated a higher MMR. A National Mortality
Survey was conducted in 1999 by the CSO and reported an MMR of 255: One hundred and seventy-eight for urban
areas and 281 for rural areas (CSO, 2012). The second one, a cause-specific maternal mortality survey, undertaken in
2004-2005 by the Ministry of Health in collaboration with UNICEF reported an even higher MMR of 316/100,000
live births (WHO-Myanmar, 2014). After lacking of nationwide maternal mortality survey data for nearly a decade, the
2014 Myanmar Census tried to provide reliable estimates on MMR (Department of Population, 2016a). According to
the Thematic Report on Maternal Mortality (2014 Myanmar Census), MMR was 282 per 100,000 live births, with 95%
confidence interval (CI)of 176-387 (Department of Population, 2016a).
Another data source, UN estimates of MMR for Myanmar were also presented as the UN inter-agency group produced
estimations and calculations based on similar available country’s data. Regarding the UN estimates, Myanmar had
made a significant progress in reducing maternal mortality as indicated by the downward trend in MMR with 60.7%
change between 1990 and 2015 (WHO-SEARO, 2016), revealing annual rate of reduction by 3.7% (95% CI: 1.6-5.3%)
(WHO, 2018c).
In this context, trend analysis for MMR was applied to MMR estimates of UN inter-agency group and the 2014
Myanmar census. The surveys data are not included in this trend analysis, because the UN inter-agency estimation already
500 [UN estimation (including surveys data)
Maternal deaths per 100,000 live births 350 & Census data]
450
Trend in MMR
400
R 2 = 0.811
300
250
200
150
100
1985 1990 1995 2000 2005 2010 2015 2020
UN est Surveys data Census data CSO data
Figure 1. Maternal mortality ratio in Myanmar (1990-2015).
Data Sources: The routine Central Statistical Organization estimates were from the Statistical Yearbook Myanmar 2010, 2016, and 2017; the UN estimates were from the
Global Health Observatory data: Maternal mortality country profiles; the survey data were from the Statistical Yearbook Myanmar 2010 and WHO Country Cooperation
Strategy (2014-2018); and the census estimate from the Thematic Report on Maternal Mortality of the 2014 Myanmar Census.
International Journal of Population Studies | 2019, Volume 5, Issue 1 29