
Page 24 - IJPS-6-1
P. 24
Inequalities in urban exposure in million-plus cities of India
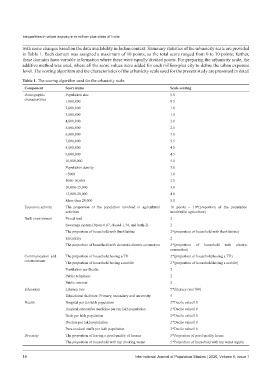
with some changes based on the data availability in Indian context. Summary statistics of the urbanicity scale are provided
in Table 1. Each domain was assigned a maximum of 10 points, so the total score ranged from 0 to 70 points; further,
these domains have variable information where these were equally divided points. For preparing the urbanicity scale, the
additive method was used, where all the score values were added for each million-plus city to define the urban exposure
level. The scoring algorithm and the characteristics of the urbanicity scale used for the present study are presented in detail
Table 1. The scoring algorithm used for the urbanicity scale.
Component Score items Scale scoring
Demographic Population size 5.0
characteristics 1,000,000 0.5
2,000,000 1.0
3,000,000 1.5
4,000,000 2.0
5,000,000 2.5
6,000,000 3.0
7,000,000 3.5
8,000,000 4.0
9,000,000 4.5
10,000,000 5.0
Population density 5.0
<5000 1.0
5000-10,000 2.0
10,000-15,000 3.0
15,000-20,000 4.0
More than 20,000 5.0
Economic activity The proportion of the population involved in agricultural 10 points – 10*(proportion of the population
activities involved in agriculture)
Built environment Paved road 2
Sewerage system (Open-0.67, closed-1.34, and both-2) 2
The proportion of household with flush latrine 2*(proportion of household with flush latrine)
Electricity 2
The proportion of household with domestic electric connection 2*(proportion of household with electric
connection)
Communication and The proportion of household having a TV 2*(proportion of household having a TV)
entertainment The proportion of household having a mobile 2*(proportion of household having a mobile)
Population per theatre 2
Public telephone 2
Public internet 2
Education Literacy rate 5*(literacy rate/100)
Educational facilities: Primary, secondary and university 5
Health Hospital per ten lakh population 2*Decile value/10
Hospital alternative medicine per ten lakh population 2*Decile value/10
Beds per lakh population 2*Decile value/10
Doctors per lakh population 2*Decile value/10
Para-medical staffs per lakh population 2*Decile value/10
Diversity The proportion of having a good quality of houses 5*Proportion of good quality house
The proportion of household with tap drinking water 5*Proportion of household with tap water supply
18 International Journal of Population Studies | 2020, Volume 6, Issue 1