
Page 26 - IJPS-6-1
P. 26
Inequalities in urban exposure in million-plus cities of India
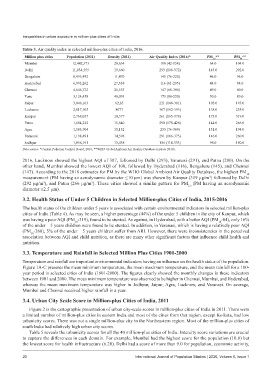
Table 3. Air quality index in selected million-plus cities of India, 2016.
Million plus cities Population (2011) Density (2011) Air Quality Index (2016)* PM ** PM **
2.5 10
Mumbai 12,442,373 20,634 100 (42-158) 64.0 104.0
Delhi 11,034,555 19,660 293 (186-372) 143.0 292.0
Bengaluru 8,495,492 11,470 145 (76-220) 46.0 96.0
Hyderabad 6,993,262 27,638 116 (61-295) 44.0 84.0
Chennai 4,646,732 26,553 147 (68-308) 49.0 80.0
Pune 3,124,458 40,093 173 (88-250) 50.0 89.0
Jaipur 3,046,163 62,85 221 (148-301) 105.0 193.0
Lucknow 2,817,105 8077 307 (192-393) 138.0 255.0
Kanpur 2,768,057 10,377 261 (165-378) 173.0 319.0
Patna 1,684,222 15,640 290 (178-426) 144.0 266.0
Agra 1,585,704 13,152 233 (76-309) 131.0 194.0
Varanasi 1,198,491 14,598 291 (186-375) 146.0 260.0
Jodhpur 1,056,191 13,438 186 (114-333) 98.0 180.0
Data source: *Central Pollution Control Board, 2016, **WHO Global Ambient Air Quality Database (update 2018).
2016, Lucknow showed the highest AQI of 307, followed by Delhi (293), Varanasi (291), and Patna (290). On the
other hand, Mumbai showed the lowest AQI of 100, followed by Hyderabad (116), Bengaluru (145), and Chennai
(147). According to the 2018 estimates for PM by the WHO Global Ambient Air Quality Database, the highest PM 10
measurement (PM having an aerodynamic diameter ≤10 μm) was shown by Kanpur (319 μg/m ) followed by Delhi
3
(292 μg/m ), and Patna (266 μg/m ). These cities showed a similar pattern for PM (PM having an aerodynamic
3
3
2.5
diameter ≤2.5 μm).
3.2. Health Status of Under 5 Children in Selected Million-plus Cities of India, 2015-2016
The health status of the children under 5 years is associated with certain environmental indicators in selected million-plus
cities of India (Table 4). As may be seen, a higher percentage (44%) of the under 5 children in the city of Kanpur, which
was having a poor AQI (PM -319), found to be stunted. As against, in Hyderabad, with a better AQI (PM -84), only 16%
10
10
of the under – 5 years children were found to be stunted. In addition, in Varanasi, which is having a relatively poor AQI
(PM -260), 5% of the under – 5 years children suffer from ARI. However, there were inconsistencies in the perceived
10
association between AQI and child nutrition, as there are many other significant factors that influence child health and
nutrition.
3.3. Temperature and Rainfall in Selected Million Plus Cities 1901-2000
Temperature and rainfall are important environmental indicators having an influence on the health status of the population.
Figure 1A-C presents the mean minimum temperature, the mean maximum temperature, and the mean rainfall for a 100-
year period in selected cities of India (1901-2000). The figures clearly showed the monthly changes in these indicators
between 1901 and 2000. The mean minimum temperature was observed to be higher in Chennai, Mumbai, and Hyderabad,
whereas the mean maximum temperature was higher in Jodhpur, Jaipur, Agra, Lucknow, and Varanasi. On average,
Mumbai and Chennai received higher rainfall in a year.
3.4. Urban City Scale Score in Million-plus Cities of India, 2011
Figure 2 is the cartographic presentation of urban city-scale scores in million-plus cities of India in 2011. There were
a limited number of million-plus cities in eastern India and most of the cities from that region, except Kolkata, had low
urbanicity scores. There was not a single million-plus city in the Northeastern region. Most of the million-plus cities of
south India had relatively high urban city scores.
Table 5 reveals the urbanicity scores for all the 40 million-plus cities of India. Intercity score variations are crucial
to capture the differences in each domain. For example, Mumbai had the highest score for the population (10.0) but
the lowest score for health infrastructure (6.20). Delhi had a score of more than 9.0 for population, economic activity,
20 International Journal of Population Studies | 2020, Volume 6, Issue 1