
Page 27 - IJPS-6-1
P. 27
Patel and Pradhan
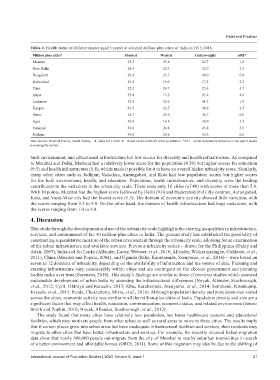
Table 4. Health status of children (under aged 5 years) in selected million-plus cities of India in 2015-2016.
Million plus cities # Stunted Wasted Underweight ARI*
Mumbai 25.5 25.8 22.7 1.8
New Delhi 28.5 20.3 32.0 2.3
Bengaluru 29.4 25.7 28.0 0.4
Hyderabad 16.4 15.0 17.2 2.3
Pune 22.3 26.7 23.6 4.1
Jaipur 35.8 13.5 25.2 4.0
Lucknow 32.0 32.0 41.5 1.9
Kanpur 43.5 22.7 38.6 2.5
Patna 34.7 29.9 36.7 0.9
Agra 39.8 14.8 30.0 3.2
Varanasi 38.6 24.8 43.8 5.0
Jodhpur 39.0 20.6 32.6 0.6
Data Source: National Family Health Survey – 4, India 2015-2016. # – Based on the district’s urban population. *ARI – Acute Respiratory Infection in the past 2 weeks
preceding the survey.
built environment, and educational infrastructure but low scores for diversity and health infrastructure. As compared
to Mumbai and Delhi, Madurai had a relatively lower score for the population (4.50) but higher scores for education
(9.5) and health infrastructure (8.8), which made it possible for it to have an overall higher urbanicity score. Similarly,
many other cities such as Jodhpur, Vadodara, Aurangabad, and Kota had low population scores but higher scores
for the built environment, health, and education. Population, health infrastructure, and diversity were the leading
contributors to the variations in the urban city scale. There were only 10 cities (of 40) with scores of more than 5.0.
With 10 points, Mumbai had the highest score followed by Delhi (9.0) and Hyderabad (8.0). By contrast, Aurangabad,
Kota, and Vasai-Virar city had the lowest score (1.5). The domain of economic activity showed little variation, with
the scores ranging from 9.3 to 9.9. On the other hand, the domain of health infrastructure had huge variations, with
the scores ranging from 1.0 to 8.8.
4. Discussion
This study through the development and use of the urbanicity scale highlights the existing inequalities in infrastructure,
services, and environment of the 40 million-plus cities in India. The present study has established the possibility of
constructing a quantitative measure of the urban environment through the urbanicity scale, allowing for an examination
of the urban infrastructure and available services. Previous urbanicity scales – drawn for the Philippines (Dahly and
Adair, 2007), India and Sri Lanka (Allender, Lacey, Webster, et al., 2010; Allender, Wickramasinghe, Goldacre, et al.,
2011), China (Mendez and Popkin, 2004), and Uganda (Riha, Karabarinde, Ssenyomo, et al., 2014) – were based on
seven to 12 domains of urbanicity, depending on the availability of information and the source of data. Planning and
existing infrastructure vary considerably within cities and are contingent on the choices government and planning
bodies make over time (Sorensen, 2018). This study’s findings are similar to those of previous studies which assessed
sustainable development of urban India by assessing the infrastructural differences (Novak, Allender, Scarborough,
et al., 2012; Cyril, Oldroyd and Renzaho, 2013; Riha, Karabarinde, Ssenyomo, et al., 2014; Sothmann, Krumkamp,
Kreuels, et al., 2015; Panda, Chakraborty, Misra, et al., 2016). Although population density and population size varied
across the cities, economic activity was similar in all the million-plus cities of India. Population density and size are a
significant factor that may affect health, education, communication, economic status, and related environment (Jones-
Smith and Popkin, 2010; Novak, Allender, Scarborough, et al., 2012).
The study found that many cities have relatively less population, but better health-care systems and educational
facilities, which may motivate people from other urban as well as rural areas to move to these cities. The results imply
that if certain places grow into urban areas but have inadequate infrastructural facilities and services, their residents may
migrate to other cities that have better infrastructure and services. For example, the recently released Indian migration
data show that nearly 800,000 people out-migrate from the city of Mumbai to nearby suburban towns/cities in search
of a better environment and affordable homes (ORGI, 2011). Some of this migration may also be due to the shifting of
International Journal of Population Studies | 2020, Volume 6, Issue 1 21