
Page 11 - IJPS-6-2
P. 11
Garenne
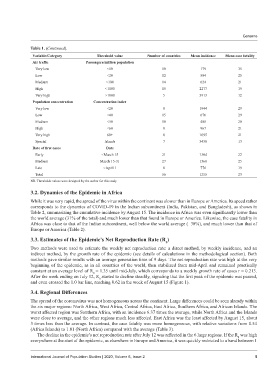
Table 1. (Continued).
Variable/Category Threshold value Number of countries Mean incidence Mean case fatality
Air traffic Passengers/million population
Very low <10 10 179 35
Low <20 12 504 25
Medium <100 14 624 21
High <1000 15 2277 19
Very high >1000 5 3913 12
Population concentration Concentration index
Very low <20 8 1944 29
Low <40 15 676 29
Medium <50 10 405 20
High <60 8 967 21
Very high 60+ 8 1095 21
Special Islands 7 3438 13
Date of first cases Date
Early <March 15 21 1304 22
Medium March 15-31 27 1360 25
Late >April 1 8 776 19
Total 56 1255 23
NB. Thresholds values were designed by the author for this study
3.2. Dynamics of the Epidemic in Africa
While it was very rapid, the spread of the virus within the continent was slower than in Europe or America. Its speed rather
corresponds to the dynamics of COVID-19 in the Indian subcontinent (India, Pakistan, and Bangladesh), as shown in
Table 2, summarizing the cumulative incidence by August 15. The incidence in Africa was even significantly lower than
the world average (31% of the total) and much lower than that found in Europe or America. Likewise, the case fatality in
Africa was close to that of the Indian subcontinent, well below the world average (−38%), and much lower than that of
Europe or America (Table 2).
3.3. Estimates of the Epidemic’s Net Reproduction Rate (R )
0
Two methods were used to estimate the weekly net reproduction rate: a direct method, by weekly incidence, and an
indirect method, by the growth rate of the epidemic (see details of calculations in the methodological section). Both
methods gave similar results with an average generation time of 9 days. The net reproduction rate was high at the very
beginning of the epidemic, as in all countries of the world, then stabilized from mid-April and remained practically
constant at an average level of R = 1.35 until mid-July, which corresponds to a weekly growth rate of cases r = 0.213.
0
After the week ending on July 12, R started to decline steadily, signaling that the first peak of the epidemic was passed,
0
and even crossed the 1.0 bar line, reaching 0.62 in the week of August 15 (Figure 1).
3.4. Regional Differences
The spread of the coronavirus was not homogeneous across the continent. Large differences could be seen already within
the six major regions: North Africa, West Africa, Central Africa, East Africa, Southern Africa, and African Islands. The
worst affected region was Southern Africa, with an incidence 6.37 times the average, while North Africa and the Islands
were close to average, and the other regions much less affected. East Africa was the least affected by August 15, about
3 times less than the average. In contrast, the case fatality was more homogeneous, with relative variations from 0.54
(Africa Islands) to 1.81 (North Africa) compared with the average (Table 3).
The decline in the epidemic’s net reproduction rate after July 12 was reflected in the 6 large regions. If the R was high
0
everywhere at the start of the epidemic, as elsewhere in Europe and America, it was quickly restricted to a band between 1
International Journal of Population Studies | 2020, Volume 6, Issue 2 5