
Page 16 - IJPS-6-2
P. 16
COVID-19 and development in Africa
wealthier countries (>$16,000, or 6 countries) had 2 times less than the previous category (1774). This relationship
resembles that of the demographic transition, but the countries in the top category were not the same (Table 1 and
Figure 5).
3.7.2. Air transport
Air transport played a fundamental role in the rapid spread of the virus around the world: The first cases in Europe were
often traced to contact with travelers from China, and the first cases in Africa to travelers returning from Europe, Italy, and
France in particular (Mehtar, Preiser, Lakhe, et al., 2020). The relationship between incidence and air traffic was indeed
strong and in line with what was expected: The greater the air traffic (in passengers per million population), the greater the
incidence, with a gradient of incidence ranging from 179 to 3913, that is, a ratio of 1 to 22 (Table 1).
3.8. Relations with Public Health
3.8.1. Medical density
The relationship with medical density was multifaceted because the more developed the country, the larger the medical
density, and the higher the capacity to diagnose cases of COVID-19. The relationship with medical density followed
approximately that noted with economic development: Fewer cases (460) when medical density was low (more than
10,000 people per doctor, or 21 countries), more cases when it was high (4346 per 1000-1999 people per doctor, or 8
countries), and again fewer cases when the medical density was very high (<1000 people per doctor, or 6 countries, close
to European levels). Therefore, it does not seem that the relationship with medical density could be explained by reporting
bias; otherwise, one would have more cases in the last category (Table 1).
3.9. Multivariate Analysis of Incidence Factors
These demographic, economic, and health parameters were, of course, inter-correlated. A multivariate analysis at the
level of the 56 countries and territories was therefore carried out. Results appear in Table 4. Two factors stood out clearly
and were statistically significant: Population density (P = 0.018) and urbanization (P = 0.030). These are, in fact, direct
epidemiological factors: The higher the density and the greater the proportion living in urban areas, the faster the virus
is transmitted, and the higher the cumulative incidence. These two factors remained stable in all multivariate analyzes,
regardless of the other variables added. To these, one must add two factors that also seem important but remained at the
limit of statistical significance: GDP per capita (P = 0.050) and mean age of population (P = 0.093). Here, it should be
noted that the effect of the mean age was reversed in the multivariate analysis: An older population corresponds to less
COVID-19, while the relationship was the other way around in the univariate analysis. These four factors explained 28%
of the variance between countries (P = 0.002).
These four factors appear to have an impact of the same order of magnitude, measured as the effect of one standard
deviation of each variable: +700 for population density; +793 for proportion urban; +812 for Log(GDP); −701 for mean
age of population, and all for an average incidence value of 1255 per million. Large variations in these variables could
therefore account for the large gradients observed between countries. When added in a stepwise procedure, the other
variables played a negligible and non-significant role when the first four factors were taken into account: Date of the first
case (P = 0.945); medical density (P = 0.959); air traffic (P = 0.887); under-five mortality (P = 0.296); and only fertility
remained at borderline statistical significance (P = 0.068).
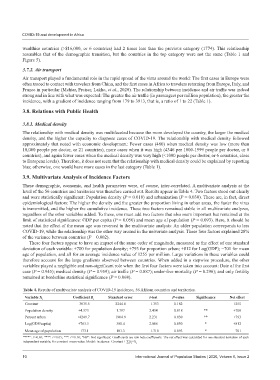
Table 4. Results of multivariate analysis of COVID-19 incidence, 56 African countries and territories.
Variable X Coefficient B Standard error t-test P-value Significance Net effect
i i
Constant −3035.5 2244.0 −1.353 0.182 1255
Population density +4.373 1.797 2.434 0.018 ** +700
Percent urban +4249.7 1904.9 2.231 0.030 ** +793
Log(GDP/capita) +763.3 380.4 2.006 0.050 * +812
Mean age of population −173.1 101.3 −1.710 0.093 * −701
“***”: P<0.01; “**”: P<0.05; “*”: P<0.10; “NS”: Not significant. Coefficients are raw beta coefficients. The net effect was calculated for one standard deviation of each
independent variable, for constant=mean value. Model: Incidence=Constant + ∑ B ×X i
i
i
10 International Journal of Population Studies | 2020, Volume 6, Issue 2