
Page 13 - IJPS-6-2
P. 13
Garenne
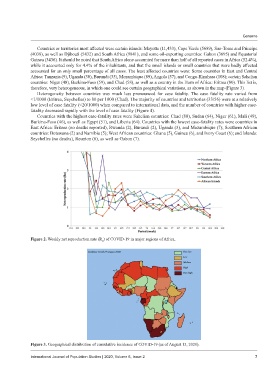
Countries or territories most affected were certain islands: Mayotte (11,433), Cape Verde (5689), Sao-Tome and Principe
(4038), as well as Djibouti (5432) and South Africa (9841), and some oil-exporting countries: Gabon (3695) and Equatorial
Guinea (3436). It should be noted that South Africa alone accounted for more than half of all reported cases in Africa (52.4%),
while it accounted only for 4.4% of the inhabitants, and that the small islands or small countries that were badly affected
accounted for an only small percentage of all cases. The least affected countries were: Some countries in East and Central
Africa: Tanzania (9), Uganda (30), Burundi (35), Mozambique (89), Angola (57), and Congo-Kinshasa (108); certain Sahelian
countries: Niger (48), Burkina-Faso (59), and Chad (58), as well as a country in the Horn of Africa: Eritrea (80). This list is,
therefore, very heterogeneous, in which one could see certain geographical variations, as shown in the map (Figure 3).
Heterogeneity between countries was much less pronounced for case fatality. The case fatality rate varied from
<1/1000 (Eritrea, Seychelles) to 80 per 1000 (Chad). The majority of countries and territories (33/56) were at a relatively
low level of case fatality (<20/1000) when compared to international data, and the number of countries with higher case-
fatality decreased rapidly with the level of case fatality (Figure 4).
Countries with the highest case-fatality rates were Sahelian countries: Chad (80), Sudan (64), Niger (61), Mali (49),
Burkina-Faso (46), as well as Egypt (51), and Liberia (64). Countries with the lowest case-fatality rates were countries in
East Africa: Eritrea (no deaths reported), Rwanda (2), Burundi (2), Uganda (3), and Mozambique (7); Southern African
countries: Botswana (2) and Namibia (5); West African countries: Ghana (5), Guinea (6), and Ivory Coast (6); and Islands:
Seychelles (no deaths), Reunion (6), as well as Gabon (7).
Figure 2. Weekly net reproduction rate (R ) of COVID-19 in major regions of Africa.
0
Figure 3. Geographical distribution of cumulative incidence of COVID-19 (as of August 15, 2020).
International Journal of Population Studies | 2020, Volume 6, Issue 2 7