
Page 26 - IJPS-6-2
P. 26
Impact of 2018 winter Olympics on the Korea Wave
2.2.5. Likeability of Hallyu
The preference for Hallyu was measured with modified items based on previous literature (Lee, Ham, and Kim, 2015).
A total of 12 items measuring the likeability of various Hallyu types (e.g., drama, entertainers, music, food, and movies)
were used to measure the variable. The reliability of this variable was 0.93 (K1), 0.97 (A1), 0.94 (K2), and 0.97 (A2).
2.2.6. The influence of Hallyu in the United States
This variable measures the respondents’ perception of the level of influence Hallyu has in the United States using these
items: “Korean films have a positive impact on US popular culture” and “Korean pop culture has a positive effect on
American pop culture.” The reliability was 0.94 (K1), 0.96 (A1), 0.93 (K2), and 0.96 (A2).
All variables used in this study are above the acceptable level of reliability. Each variable was measured with multiple
items. A composite measure was created by summing the items for each variable and was used for further analyses.
Independent sample t-tests were conducted to answer the two research questions to determine changes in responses before
and after the Games.
2.3. Demographic Profiles
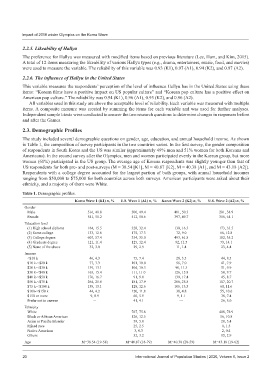
The study included several demographic questions on gender, age, education, and annual household income. As shown
in Table 1, the composition of survey participants in the two countries varies. In the first survey, the gender composition
of respondents in South Korea and the US was similar (approximately 49% men and 51% women for both Koreans and
Americans). In the second survey after the Olympics, men and women participated evenly in the Korean group, but more
women (61%) participated in the US group. The average age of Korean respondents was slightly younger than that of
US respondents for both pre- and post-surveys (M = 38.54 [K1], M = 40.87 [K2], M = 40.38 [A1], and M = 43.18 [A2]).
Respondents with a college degree accounted for the largest portion of both groups, with annual household incomes
ranging from $50,000 to $75,000 for both countries across both surveys. American participants were asked about their
ethnicity, and a majority of them were White.
Table 1. Demographic profiles.
Korea Wave 1 (K1) n, % U.S. Wave 1 (A1) n, % Korea Wave 2 (K2) n, % U.S. Wave 2 (A2) n, %
Gender
Male 516, 48.8 500, 49.4 401, 50.3 201, 38.9
Female 541, 51.2 512, 50.6 397, 49.7 316, 61.1
Education level
(1) High school diploma 164, 15.5 328, 32.4 130, 16.3 173, 33.5
(2) Some college 133, 12.6 175, 17.3 72, 9.0 66, 12.8
(3) College degree 607, 57.4 354, 35.0 493, 61.8 182, 35.2
(4) Graduate degree 121, 11.4 125, 12.4 92, 11.5 73, 14.1
(5) None of the above 32, 3.0 29, 2.9 11, 1.4 23, 4.4
Income
<$10 k 46, 4.3 75, 7.4 28, 3.5 44, 8.5
$10 k-<$20 k 77, 7.3 101, 10.0 56, 7.0 41, 7.9
$20 k-<$30 k 139, 13.1 104, 10.3 90, 11.3 51, 9.9
$30 k-<$40 k 163, 15.4 111, 11.0 126, 15.8 50, 9.7
$40 k-<$50 k 176, 16.7 91, 9.0 139, 17.4 45, 8.7
$50 k-<$75 k 264, 25.0 181, 17.9 206, 25.8 107, 20.7
$75 k-<$100 k 139, 13.1 128, 12.6 106, 13.3 60, 11.6
$100-<$150 k 44, 4.2 120, 11.8 38, 4.8 55, 10.6
$150 or more 9, 0.9 60, 5.9 9, 1.1 38, 7.4
Prefer not to answer -- 41, 4.1 --- 26, 5.0
Ethnicity
White 767, 75.8 408, 78.9
Black or African American 126, 12.5 56, 10.8
Asian or Pacific Islander 59, 5.8 28, 5.4
Mixed race 25, 2.5 8, 1.5
Native American 3, 0.3 2, 0.4
Others 32, 3.2 15, 2.9
Age M=38.54 (19-58) M=40.87 (18-79) M=40.38 (20-59) M=43.18 (19-62)
20 International Journal of Population Studies | 2020, Volume 6, Issue 2