
Page 125 - IJPS-7-1
P. 125
Nagarajan and Sahoo
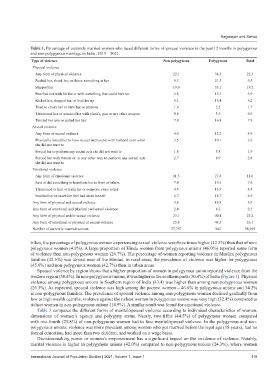
Table 1. Percentage of currently married women who faced different forms of spousal violence in the past 12 months in polygynous
and non-polygynous marriage in India, 2019 – 2021.
Type of violence Non‑polygynous Polygynous Total
Physical violence
Any form of physical violence 22.1 38.5 22.3
Pushed her, shook her, or threw something at her 9.3 21.5 9.5
Slapped her 19.0 33.1 19.2
Punched her with his fist or with something that could hurt her 5.8 15.3 5.9
Kicked her, dragged her, or beat her up 6.1 13.4 6.2
Tried to choke her or burn her on purpose 1.6 5.5 1.7
Threatened her or attacked her with a knife, gun or any other weapon 0.8 3.9 0.9
Twisted her arm or pulled her hair 7.8 16.8 7.9
Sexual violence
Any form of sexual violence 4.8 12.2 4.9
Physically forced her to have sexual intercourse with husband even when 3.5 10.1 3.6
she did not want to
Forced her to perform any sexual acts she did not want to 1.8 3.8 1.9
Forced her with threats or in any other way to perform any sexual acts 2.7 8.9 2.8
she did not want to
Emotional violence
Any form of emotional violence 11.3 27.8 11.6
Said or did something to humiliate her in front of others 7.4 19.5 7.6
Threatened to hurt or harm her or someone close to her 4.6 13.9 4.8
Insulted her or made her feel bad about herself 6.7 18.7 6.9
Any form of physical and sexual violence 3.8 10.3 3.9
Any form of emotional and physical and sexual violence 2.4 8.2 2.5
Any form of physical and/or sexual violence 23.1 40.4 23.4
Any form of emotional or physical or sexual violence 25.8 44.5 26.1
Number of currently-married women 57,757 942 58,699
tribes, the percentage of polygynous women experiencing sexual violence was three times higher (12.2%) than that of non-
polygynous women (4.8%). A large proportion of Hindu women from polygynous unions (46.0%) reported some form
of violence than non-polygynous women (26.7%). The percentage of women reporting violence in Muslim polygynous
families (42.5%) was almost near of the Hindus. In rural areas, the prevalence of violence was higher for polygynous
(45.0%) and non-polygynous women (42.7%) than in urban areas.
Spousal violence by region shows that a higher proportion of women in polygynous union reported violence from the
western region (50.4%). In non-polygynous unions, it was higher in the southern parts (30.4%) of India (Figure 1). Physical
violence among polygynous unions in Southern region of India (43.4) was higher than among non-polygynous women
(26.3%). As expected, spousal violence was high among the poorest women – 46.8% in polygynous unions and 34.2%
in non-polygynous families. The prevalence of spousal violence among non-polygynous women declined gradually from
low to high wealth quintile, violence against the richest women in polygynous unions was very high (32.4%) compared to
richest women in non-polygynous unions (14.9%). A similar result was found for emotional violence.
Table 3 compares the different forms of marital/spousal violence according to individual characteristics of women,
dimensions of women’s agency and polygyny status. Nearly, two-fifths (44.5%) of polygynous women compared
with one-fourth (25.8%) of non-polygynous women had to face marital/spousal violence. In the polygynous and non-
polygynous unions, violence was more prevalent among women who got married before the legal age (18 years), had no
formal education, had more than two children, and worked on a wage basis.
Decision-making power or women’s empowerment has a significant impact on the incidence of violence. Notably,
marital violence is higher in polygynous unions (42.0%) compared to non-polygynous unions (24.3%), where women
International Journal of Population Studies | 2021, Volume 7, Issue 1 119