
Page 126 - IJPS-7-1
P. 126
Polygyny and spousal violence in India
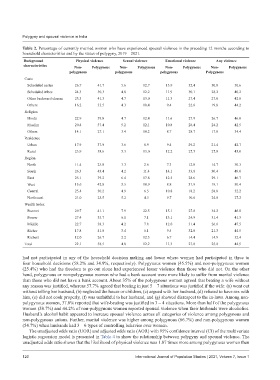
Table 2. Percentage of currently married women who have experienced spousal violence in the preceding 12 months according to
household characteristics and by the status of polygyny, 2019 – 2021.
Background Physical violence Sexual violence Emotional violence Any violence
characteristics Non‑ Polygynous Non‑ Polygynous Non‑ Polygynous Non‑ Polygynous
polygynous polygynous polygynous Polygynous
Caste
Scheduled castes 26.7 41.7 5.6 12.7 13.9 32.4 30.8 50.6
Scheduled tribes 24.3 30.3 4.8 12.2 11.9 30.1 28.2 40.2
Other backward classes 23.3 41.3 4.7 13.0 11.3 27.4 27.0 42.8
Others 16.2 35.5 4.3 10.4 9.4 22.6 19.8 44.2
Religion
Hindu 22.9 39.8 4.7 12.4 11.6 27.9 26.7 46.0
Muslim 20.4 37.4 5.2 12.1 10.8 28.4 24.2 42.5
Others 14.1 27.1 3.4 10.2 8.7 28.7 17.8 34.4
Residence
Urban 17.9 37.9 3.6 8.9 9.4 29.2 21.4 42.7
Rural 23.9 38.6 5.3 13.0 12.2 27.5 27.8 45.0
Region
North 11.4 23.8 3.3 2.6 7.3 12.0 14.7 30.3
South 26.3 43.4 4.2 11.4 14.1 33.8 30.4 49.0
East 25.1 39.2 6.4 17.8 12.5 28.6 29.1 46.7
West 15.6 42.8 3.5 10.9 8.8 31.9 19.1 50.4
Central 25.4 30.2 4.9 6.5 10.8 18.2 28.8 32.2
North-east 21.0 23.5 5.2 4.3 9.7 10.6 24.8 27.2
Wealth Index
Poorest 29.7 41.1 7.9 22.5 15.1 27.8 34.2 46.8
Poorer 27.4 35.7 6.0 7.1 13.1 24.9 31.4 41.3
Middle 22.7 38.3 4.2 7.8 12.0 31.4 26.6 47.5
Richer 17.8 41.8 3.4 6.1 9.5 32.0 21.3 44.5
Richest 12.0 26.7 2.2 12.3 6.7 14.4 14.9 32.4
Total 22.1 38.5 4.8 12.2 11.3 27.8 25.8 44.5
had not participated in any of the household decision making and lower where women had participated in three to
four household decisions (58.2% and 34.9%, respectively). Polygynous women (45.5%) and non-polygynous women
(25.4%) who had the freedom to go out alone had experienced lesser violence than those who did not. On the other
hand, polygynous or non-polygynous women who had a bank account were more likely to suffer from marital violence
than those who did not have a bank account. About 35% of the polygynous women agreed that beating a wife without
any reason was justified, whereas 57.7% agreed that beating in just 5 – 7 situations was justified if the wife: (a) went out
without telling her husband, (b) neglected the house or children, (c) argued with her husband, (d) refused to have sex with
him, (e) did not cook properly, (f) was unfaithful to her husband, and (g) showed disrespect to the in-laws. Among non-
polygynous women, 37.8% reported that wife-beating was justified in 3 – 4 situations. More than half of the polygynous
women (58.7%) and 44.2% of non-polygynous women reported spousal violence when their husbands were alcoholics.
Husband’s alcohol habit appeared to increase spousal violence across all categories of violence among polygynous and
non-polygynous unions. Further, marital violence was higher among polygynous (66.7%) and non-polygynous women
(54.7%) when husbands had 3 – 6 types of controlling behavior over women.
The unadjusted odds ratio (UOR) and adjusted odds ratio (AOR) with 95% confidence interval (CI) of the multivariate
logistic regression model is presented in Table 4 to show the relationship between polygyny and spousal violence. The
unadjusted odds ratio shows that the likelihood of physical violence was 1.87 times more among polygynous women than
120 International Journal of Population Studies | 2021, Volume 7, Issue 1