
Page 62 - IJPS-7-1
P. 62
Family size preference among women in Nigeria
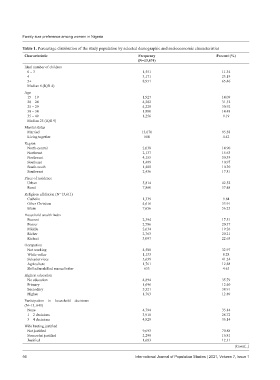
Table 1. Percentage distribution of the study population by selected demographic and socioeconomic characteristics
Characteristic Frequency Percent (%)
(N=13,674)
Ideal number of children
0 – 3 1,551 11.34
4 3,171 23.19
5+ 8,951 65.46
Median 6 (IQR 4)
Age
15 – 19 1,927 14.09
20 – 24 4,282 31.32
25 – 29 4,228 30.92
30 – 34 1,980 14.48
35 – 49 1,256 9.19
Median 25 (IQR 9)
Marital status
Married 13,070 95.58
Living together 604 4.42
Region
North-central 2,038 14.90
Northeast 2,137 15.63
Northwest 4,155 30.39
Southeast 1,499 10.97
South-south 1,408 10.30
Southwest 2,436 17.81
Place of residence
Urban 5,814 42.52
Rural 7,860 57.48
Religious affiliation (N=13,611)
Catholic 1,339 9.84
Other Christian 4,616 33.91
Islam 7,656 56.25
Household wealth index
Poorest 2,394 17.51
Poorer 2,786 20.37
Middle 2,634 19.26
Richer 2,763 20.21
Richest 3,097 22.65
Occupation
Not working 4,508 32.97
White-collar 1,133 8.28
Sales/services 5,639 41.24
Agriculture 1,761 12.88
Skilled/unskilled manual/other 633 4.63
Highest education
No education 4,894 35.79
Primary 1,696 12.40
Secondary 5,321 38.91
Higher 1,763 12.89
Participation in household decisions
(N=13, 641)
None 4,794 35.14
1 – 2 decisions 3,918 28.72
3 – 4 decisions 4,929 36.14
Wife beating justified
Not justified 9,693 70.88
Somewhat justified 2,298 16.81
Justified 1,683 12.31
(Contd...)
56 International Journal of Population Studies | 2021, Volume 7, Issue 1