Page 64 - IJPS-7-1
P. 64

Family size preference among women in Nigeria

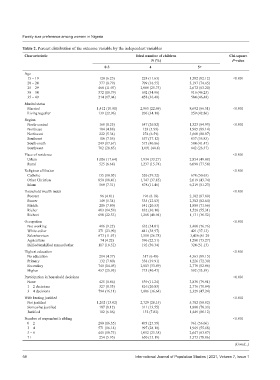
           Table 2. Percent distribution of the outcome variable by the independent variables
           Characteristic                                  Ideal number of children                Chi‑square
                                                                 N (%)                              P‑value
                                             0‑3                 4                   5+
           Age
             15 – 19                       120 (6.25)        224 (11.63)          1,582 (82.12)     <0.001
             20 – 24                       377 (8.79)        709 (16.55)          3,197 (74.65)
             25 – 29                       468 (11.07)       1,088 (25.73)        2,672 (63.20)
             30 – 34                       372 (18.79)       692 (34.96)          916 (46.25)
             35 – 49                       214 (17.04)       458 (36.48)          584 (46.48)
           Marital status
             Married                      1,412 (10.81)      2,965 (22.69)        8,692 (66.51)     <0.001
             Living together               139 (22.96)       206 (34.18)          259 (42.86)
           Region
             North-central                 168 (8.25)        547 (26.82)          1,323 (64.93)     <0.001
             Northeast                     104 (4.88)         128 (5.99)          1,905 (89.14)
             Northwest                     222 (5.34)         274 (6.59)          3,660 (88.07)
             Southeast                     106 (7.05)        557 (37.12)          837 (55.83)
             South-south                   249 (17.67)       575 (40.86)          584 (41.47)
             Southwest                     702 (28.83)       1,091 (44.8)         642 (26.37)
           Place of residence                                                                       <0.001
             Urban                        1,026 (17.64)      1,934 (33.27)        2,854 (49.08)
             Rural                         525 (6.68)        1,237 (15.74)        6,098 (77.58)
           Religious affiliation                                                                    <0.001
             Catholic                      135 (10.05)       526 (39.32)          678 (50.63)
             Other Christian               850 (18.41)       1,747 (37.85)        2,019 (43.74)
             Islam                         560 (7.31)        878 (11.46)          6,219 (81.23)
           Household wealth index                                                                   <0.001
             Poorest                        96 (4.01)         196 (8.18)          2,102 (87.80)
             Poorer                        149 (5.34)        335 (12.03)          2,302 (82.64)
             Middle                        206 (7.80)        541 (20.53)          1,888 (71.66)
             Richer                        403 (14.59)       832 (30.10)          1,528 (55.31)
             Richest                       698 (22.53)       1,268 (40.94)        1,131 (36.52)
           Occupation                                                                               <0.001
             Not working                   416 (9.22)        632 (14.01)          3,460 (76.76)
             White-collar                  271 (23.90)       441 (38.97)          421 (37.13)
             Sales/services                673 (11.93)       1,510 (26.78)        3,456 (61.29
             Agriculture                    74 (4.22)        396 (22.51)          1,290 (73.27)
             Skilled/unskilled manual/other  117 (18.52)     192 (30.34)          324 (51.13)
           Highest education                                                                        <0.001
             No education                  214 (4.37)         317 (6.48)          4,363 (89.15)
             Primary                       132 (7.80)        338 (19.91)          1,226 (72.30)
             Secondary                     748 (14.05)       1,803 (33.89)        2,770 (52.06)
             Higher                        457 (25.95)       713 (40.47)          592 (33.59)
           Participation in household decisions                                                     <0.001
             None                          425 (8.86)        539 (11.24)          3,830 (79.91)
             1 – 2 decisions               327 (8.33)        816 (20.83)          2,776 (70.84)
             3 – 4 decisions               794 (16.11)       1,806 (36.64)        2,329 (47.24)
           Wife beating justified                                                                   <0.001
             Not justified                1,262 (13.02)      2,729 (28.15)        5,702 (58.82)
             Somewhat justified            187 (8.12)        311 (13.55)          1,800 (78.33)
             Justified                     102 (6.06)         132 (7.82)          1,449 (86.12)
           Number of respondent’s sibling                                                           <0.001
             0 – 2                         280 (16.35)       473 (27.59)          961 (56.06)
             3 – 4                         571 (16.14)       997 (28.18)          1,969 (55.68)
             5 – 6                         445 (10.75)       1,052 (25.38)        2,647 (63.87)
             7+                            254 (5.95)        650 (15.19)          3,373 (78.86)
                                                                                                     (Contd...)

           58                                              International Journal of Population Studies | 2021, Volume 7, Issue 1
   59   60   61   62   63   64   65   66   67   68   69