
Page 30 - IJPS-9-1
P. 30
International Journal of
Population Studies Population aging and immigration in Japan
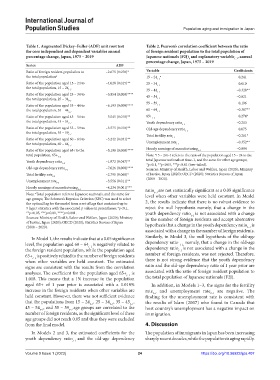
Table 1. Augmented Dickey–Fuller (ADF) unit root test Table 2. Pearson’s correlation coefficient between the ratio
for core independent and dependent variables annual of foreign resident population to the total population of
percentage change, Japan, 1975 – 2019 Japanese nationals (F2J) and explanatory variable , annual
t
t–1
percentage change, Japan, 1975 – 2019
Series ADF
Ratio of foreign resident population to –2.675 (0.078)* Variable Coefficients
the total population a 15 – 24 a 0.241
t–1
Ratio of the population aged 15 – 24 to –4.028 (0.015)** 25 – 34 t–1 0.010
the total population, 15 – 24
t–1 35 – 44 –0.320**
Ratio of the population aged 25 – 34 to –5.854 (0.000)**** 45 – 54 t–1 –0.021
the total population, 25 – 34 t–1
t–1
Ratio of the population aged 35 – 44 to –6.193 (0.000)**** 55 – 59 t–1 0.196
the total population, 35 – 44 t–1 60 – 64 t–1 –0.367**
Ratio of the population aged 45 – 54 to –3.545 (0.018)** 65+ t–1 0.274*
the total population, 45 – 54
t–1 Youth dependency ratio t–1 –0.213
Ratio of the population aged 55 – 59 to –3.575 (0.010)** Old-age dependency ratio 0.075
the total population, 55 – 59 t–1
t–1 Total fertility rate –0.261*
Ratio of the population aged 60 – 64 to –3.242 (0.031)** t–1
the total population, 60 – 64 Unemployment rate t–1 –0.352**
t–1
Ratio of the population aged 65+to the –5.196 (0.000)**** Hourly earnings of manufacturing t–1 –0.094
total population, 65+ Note: 15 – 24t–1 refers to the ratio of the population aged 15 – 24 to the
a
t–1
Youth dependency ratio t–1 –1.972 (0.047)** total Japanese nationals at time–1, and the same for other age groups;
*p<0.1, **p<0.05, ***p<0.01 (two-tailed).
Old-age dependency ratio t–1 –7.026 (0.000)**** Sources: Ministry of Health, Labor and Welfare, Japan (2020); Ministry
Total fertility rate –2.795 (0.068)* of Justice, Japan (2020); OECD (2020); Statistics Bureau of Japan
t–1
Unemployment rate –3.556 (0.011)** (2000 – 2020).
t–1
Hourly earnings of manufacturing –4.234 (0.001)***
t–1 ratio are not statistically significant at a 0.05 significance
t–1
Note: Total population refers to Japanese nationals, and the same for level when other variables were held constant. In Model
a
age groups; The Schwarz’s Bayesian Criterion (SBC) was used to select
the optimal lag for the model from a set of lags that contained up to 2, the results indicate that there is no robust evidence to
9 lags; t statistics with the associated p values in parentheses; *p<0.1, reject the null hypothesis namely, that a change in the
**p<0.05, ***p<0.01, ****p<0.001. youth dependency ratio is not associated with a change
t–1
Sources: Ministry of Health, Labor and Welfare, Japan (2020); Ministry in the number of foreign residents and accept alternative
of Justice, Japan (2020); OECD (2020); Statistics Bureau of Japan hypothesis that a change in the youth dependency ratio is
(2000 – 2020). t–1
associated with a change in the number of foreign residents.
In Model 1, the results indicate that at a 0.05 significance Similarly, in Model 3, the null hypothesis of the old-age
level, the population aged 60 – 64 is negatively related to dependency ratio namely, that a change in the old-age
t–1,
t–1
the foreign resident population, while the population aged dependency ratio is not associated with a change in the
t–1
65+ is positively related to the number of foreign residents number of foreign residents, was not rejected. Therefore,
t–1
when other variables are held constant. The estimated there is not strong evidence that the youth dependency
signs are consistent with the results from the correlation ratio and the old-age dependency ratio of 1 year prior are
analyses. The coefficient for the population aged 65+ is associated with the ratio of foreign resident population to
t–1
1.018. This means that a 1% increase in the population the total population of Japanese nationals (F2J).
aged 65+ of 1 year prior is associated with a 1.018% In addition, in Models 1–3, the signs for the fertility
increase in the foreign residents when other variables are rate and unemployment rate are negative. The
t–1
t–1
held constant. However, there was not sufficient evidence finding for the unemployment rate is consistent with
that the populations from 15 – 24 , 25 – 34 , 35 – 45 , the results of Islam (2007) who found in Canada that
t–1
t–1
t–1
45 – 54 , and 55 – 59 age groups are correlated to the host country’s unemployment has a negative impact on
t–1
t–1
number of foreign residents, as the significant level of these immigration.
age groups did not reach 0.05 and thus they were excluded
from the final model. 4. Discussion
In Models 2 and 3, the estimated coefficients for the The population of immigrants in Japan has been increasing
youth dependency ratio t–1 and the old-age dependency sharply recent decades, while the population is aging rapidly.
Volume 9 Issue 1 (2023) 24 https://doi.org/10.36922/ijps.407