
Page 29 - IJPS-9-1
P. 29
International Journal of
Population Studies Population aging and immigration in Japan
A B
C
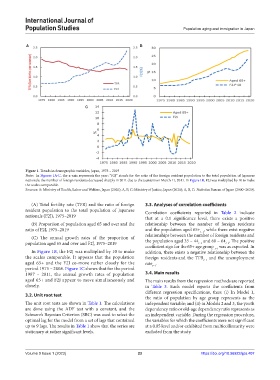
Figure 1. Trends in demographic variables, Japan, 1975 – 2019
Note: In Figures 1A-C, the x-axis represents the year; “F2J” stands for the ratio of the foreign resident population to the total population of Japanese
nationals; the number of foreign residents decreased sharply in 2011 due to the tsunami on March 11, 2011. In Figure 1B, F2J was multiplied by 10 to make
the scales comparable.
Sources: A: Ministry of Health, Labor and Welfare, Japan (2020); A, B, C: Ministry of Justice, Japan (2020); A, B, C: Statistics Bureau of Japan (2000–2020).
(A) Total fertility rate (TFR) and the ratio of foreign 3.3. Analyses of correlation coefficients
resident population to the total population of Japanese Correlation coefficients reported in Table 2 indicate
nationals (F2J), 1975–2019 that at a 0.1 significance level, there exists a positive
(B) Proportion of population aged 65 and over and the relationship between the number of foreign residents
ratio of F2J, 1975–2019 and the population aged 65+ , while there exist negative
t–1
relationships between the number of foreign residents and
(C) The annual growth rates of the proportion of
population aged 65 and over and F2J, 1975–2019 the population aged 35 – 44 and 60 – 64 . The positive
t–1
t–1
coefficient sign for the 65+ age group was as expected. In
t–1
In Figure 1B, the F2J was multiplied by 10 to make addition, there exists a negative relationship between the
the scales comparable. It appears that the population foreign residents and the TFR and the unemployment
t–1
aged 65+ and the F2J co-move rather closely for the rate .
t–1
period 1975 – 2008. Figure 1C shows that for the period
1987 – 2011, the annual growth rates of population 3.4. Main results
aged 65+ and F2J appear to move simultaneously and The main results from the regression methods are reported
closely. in Table 3. Each model reports the coefficients from
different regression specifications, thus: (i) In Model 1,
3.2. Unit root test
the ratio of population by age group represents as the
The unit root tests are shown in Table 1. The calculations independent variable; and (ii) in Models 2 and 3, the youth
are done using the ADF test with a constant, and the dependency ratio or old-age dependency ratio represents as
Schwarz’s Bayesian Criterion (SBC) was used to select the an independent variable. During the regression procedure,
optimal lag for the model from a set of lags that contained the variables for which the coefficients were not significant
up to 9 lags. The results in Table 1 show that the series are at a 0.05 level and/or exhibited from multicollinearity were
stationary at rather significant levels. excluded from the study.
Volume 9 Issue 1 (2023) 23 https://doi.org/10.36922/ijps.407