
Page 59 - IJPS-9-2
P. 59
International Journal of
Population Studies Personality traits in homosexual men in Iran
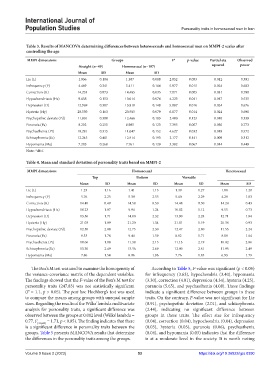
Table 3. Results of MANCOVA determining differences between heterosexuals and homosexual men on MMPI‑2 scales after
controlling the age
MMPI dimensions Groups F* p‑value Partial eta Observed
Straight (n=49) Homosexual (n=197) squared power
Mean SD Mean SD
Lie (L) 1.036 0.184 1.387 0.088 2.852 0.093 0.012 0.391
Infrequency (F) 4.469 0.341 5.411 0.164 5.977 0.015 0.024 0.683
Correction (K) 14.253 0.073 14.485 0.035 7.871 0.005 0.031 0.798
Hypochondriasis (Hs) 9.658 0.153 10.014 0.074 4.223 0.041 0.017 0.535
Depression (D) 12.969 0.307 13.810 0.148 5.887 0.016 0.024 0.676
Hysteria (Hy) 20.530 0.163 20.985 0.079 6.077 0.014 0.024 0.690
Psychopathic deviate (Pd) 11.801 0.380 12.466 0.183 2.400 0.123 0.010 0.339
Paranoia (Pa) 8.202 0.255 8.985 0.123 7.395 0.007 0.030 0.773
Psychasthenia (Pt) 10.281 0.315 11.047 0.152 4.627 0.032 0.019 0.572
Schizophrenia (Sc) 12.245 0.401 12.914 0.193 2.177 0.141 0.009 0.312
Hypomania (Ma) 7.205 0.268 7.761 0.129 3.382 0.067 0.014 0.449
Note: *df=1
Table 4. Mean and standard deviation of personality traits based on MMPI‑2
MMPI dimensions Homosexual Heterosexual
Top Bottom Versatile
Mean SD Mean SD Mean SD Mean SD
Lie (L) 1.23 1.16 1.41 1.13 1.39 1.27 1.08 1.20
Infrequency (F) 5.76 2.25 5.38 2.55 5.40 2.29 4.28 1.83
Correction (K) 14.40 0.49 14.58 0.50 14.48 0.50 14.24 0.43
Hypochondriasis (Hs) 10.23 1.07 9.94 1.24 10.02 1.12 9.55 0.73
Depression (D) 13.56 1.71 14.00 2.32 13.90 2.28 12.71 1.84
Hysteria (Hy) 21.03 1.09 21.20 1.34 21.01 1.19 20.38 0.93
Psychopathic deviate (Pd) 12.50 2.08 12.75 2.30 12.47 2.80 11.55 2.24
Paranoia (Pa) 9.33 1.78 9.44 1.59 8.82 1.71 8.08 1.64
Psychasthenia (Pt) 10.66 1.88 11.38 2.15 11.13 2.19 10.02 2.06
Schizophrenia (Sc) 13.30 2.49 13.36 2.69 12.80 2.81 11.95 2.49
Hypomania (Ma) 7.86 1.54 8.06 1.96 7.76 1.85 6.93 1.79
The Box’s M test was used to examine the homogeneity of According to Table 5, F-value was significant (p < 0.05)
the variance-covariance matrix of the dependent variables. for infrequency (3.63), hypochondria (3.40), hypomania
The findings showed that the F-value of the Box’s M test for (3.30), correction (4.01), depression (4.34), hysteria (4.25),
personality traits (247.83) was not statistically significant paranoia (5.65), and psychasthenia (4.08). These findings
(F = 1.1, p > 0.05). The post hoc Hochberg’s test was used indicate a significant difference between groups in these
to compare the means among groups with unequal sample traits. On the contrary, F-value was not significant for Lie
sizes. Regarding the results of the Wilks’ lambda multivariate (0.91), psychopathic deviation (2.01), and schizophrenia
analysis for personality traits, a significant difference was (2.44), indicating no significant difference between
observed between the groups at 0.002 level (Wilks’ lambda = groups in these traits. The effect size for infrequency
0.77, F (33,684) = 1.71, p < 0.05). The finding indicates that there (0.04), correction (0.04), hypochondria (0.04), depression
is a significant difference in personality traits between the (0.05), hysteria (0.05), paranoia (0.06), psychasthenia
groups. Table 5 presents MANCOVA results that determine (0.04), and hypomania (0.03) indicates that the difference
the differences in the personality traits among the groups. is at a moderate level in the society. It is worth noting
Volume 9 Issue 2 (2023) 53 https://doi.org/10.36922/ijps.0390