
Page 60 - IJPS-9-2
P. 60
International Journal of
Population Studies Personality traits in homosexual men in Iran
Table 5. MANCOVA results to determine differences in personality traits using MMPI‑2 in homosexual men
MMPI dimensions SS df MS F p‑value Partial eta squared Observed power
Lie (L) 4.11 3 1.37 0.91 0.430 0.01 0.24
Infrequency (F) 57.22 3 19.07 3.63 0.010 0.04 0.79
Correction (K) 2.87 3 0.95 4.01 0.008 0.04 0.83
Hypochondriasis (Hs) 10.89 3 3.63 3.40 0.010 0.04 0.76
Depression (D) 56.52 3 18.75 4.34 0.005 0.05 0.86
Hysteria (Hy) 15.71 3 5.23 4.25 0.006 0.05 0.85
Psychopathic deviate (Pd) 39.63 3 13.21 2.01 0.110 0.02 0.51
Paranoia (Pa) 48.63 3 16.21 5.65 0.001 0.06 0.94
Psychasthenia (Pt) 55.52 3 18.50 4.08 0.007 0.04 0.84
Schizophrenia (Sc) 53.39 3 17.79 2.44 0.060 0.02 0.60
Hypomania (Ma) 33.01 3 11.00 3.30 0.020 0.03 0.74
that the effect size was considered small, moderate,
and large at 0.01, 006, and 0.14, respectively (Cohen,
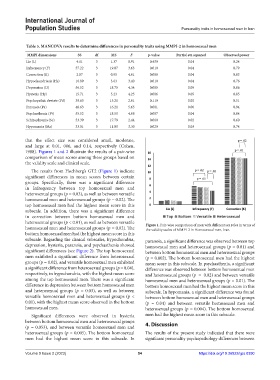
1988). Figures 1 and 2 illustrate the results of a pair-wise
comparison of mean scores among these groups based on
the validity scale and clinical scale.
The results from Hochberg’s GT2 (Figure 1) indicate
significant differences in mean scores between certain
groups. Specifically, there was a significant difference
in Infrequency between top homosexual men and
heterosexual groups (p = 0.03), as well as between versatile
homosexual men and heterosexual groups (p = 0.02). The
top homosexual men had the highest mean score in this
subscale. In addition, there was a significant difference
in correction between bottom homosexual men and
heterosexual groups (p < 0.01), as well as between versatile Figure 1. Pair-wise comparison of men with different sex roles in terms of
homosexual men and heterosexual groups (p = 0.02). The the validity scales of MMPI-2 in Homosexual men, Iran.
bottom homosexual men had the highest mean score in this
subscale. Regarding the clinical subscales, hypochondria, paranoia, a significant difference was observed between top
depression, hysteria, paranoia, and psychasthenia showed homosexual men and heterosexual groups (p = 0.01) and
significant differences (see Figure 2). The top homosexual between bottom homosexual men and heterosexual groups
men exhibited a significant difference from heterosexual (p = 0.002). The bottom homosexual men had the highest
groups (p = 0.02), and versatile homosexual men exhibited mean score in this subscale. In psychasthenia, a significant
a significant difference from heterosexual groups (p = 0.04), difference was observed between bottom homosexual men
respectively, in hypochondria, with the highest mean score and heterosexual groups (p = 0.02) and between versatile
among the top homosexual men. There was a significant homosexual men and heterosexual groups (p = 0.01). The
difference in depression between bottom homosexual men bottom homosexual men had the highest mean score in this
and heterosexual groups (p = 0.03), as well as between subscale. In hypomania, a significant difference was found
versatile homosexual men and heterosexual groups (p < between bottom homosexual men and heterosexual groups
0.01), with the highest mean score observed in the bottom (p = 0.04) and between versatile homosexual men and
homosexual men. heterosexual groups (p = 0.004). The bottom homosexual
Significant differences were observed in hysteria men had the highest mean score in this subscale.
between bottom homosexual men and heterosexual groups
(p = 0.053), and between versatile homosexual men and 4. Discussion
heterosexual groups (p = 0.005). The bottom homosexual The results of the present study indicated that there were
men had the highest mean score in this subscale. In significant personality psychopathology differences between
Volume 9 Issue 2 (2023) 54 https://doi.org/10.36922/ijps.0390