
Page 85 - IJPS-9-2
P. 85
International Journal of
Population Studies Development service in East Malaysia Suburban
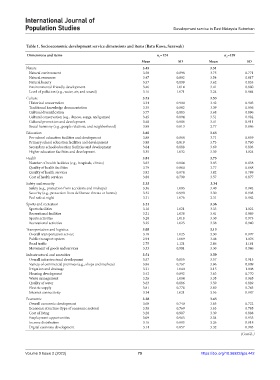
Table 1. Socioeconomic development service dimensions and items (Batu Kawa, Sarawak)
Dimensions and items n =124 n =159
1
2
Mean SD Mean SD
Nature 3.45 3.51
Natural environment 3.58 0.898 3.75 0.771
Natural resources 3.47 0.892 3.54 0.817
Natural beauty 3.57 0.899 3.62 0.833
Environmental-friendly development 3.46 1.014 3.41 0.880
Level of pollution (e.g., water, air, and sound) 3.16 1.071 3.24 0.944
Culture 3.53 3.53
Historical conservation 3.34 0.900 3.42 0.905
Traditional knowledge documentation 3.35 0.882 3.39 0.956
Cultural diversification 3.77 0.883 3.68 0.896
Cultural conservation (e.g., dances, songs, and games) 3.45 0.894 3.51 0.982
Cultural promotion and development 3.48 0.886 3.41 0.911
Social harmony (e.g., people relations, and neighborhood) 3.80 0.813 3.77 0.846
Education 3.65 3.63
Pre-school education facilities and development 3.80 0.868 3.71 0.859
Primary school education facilities and development 3.80 0.819 3.73 0.760
Secondary school education facilities and development 3.64 0.888 3.69 0.803
Higher education facilities and development 3.35 1.032 3.39 1.024
Health 3.81 3.75
Number of health facilities (e.g., hospitals, clinics) 3.83 0.884 3.85 0.838
Quality of health facilities 3.79 0.880 3.77 0.888
Quality of health services 3.82 0.878 3.82 0.789
Cost of health services 3.80 0.799 3.57 0.877
Safety and security 3.33 3.34
Safety (e.g., protection from accidents and mishaps) 3.36 1.005 3.40 0.942
Security (e.g., protection from deliberate threats or harms) 3.32 0.990 3.30 0.905
Feel safe at night 3.31 1.076 3.31 0.982
Sports and recreation 3.21 3.36
Sports facilities 3.16 1.021 3.33 1.022
Recreational facilities 3.21 1.038 3.41 0.989
Sports activities 3.20 1.018 3.30 0.973
Recreational activities 3.25 1.025 3.38 0.940
Transportation and logistics 3.05 3.13
Overall transportation service 3.18 1.025 3.30 0.997
Public transport system 2.94 1.089 3.08 1.076
Road traffic 2.75 1.121 2.86 1.161
Movement of goods and services 3.33 0.901 3.30 0.946
Infrastructural and amenities 3.51 3.59
Overall infrastructural development 3.57 0.855 3.57 0.913
Variety of commercial premises (e.g., shops and markets) 3.86 0.767 3.96 0.809
Irrigation and drainage 3.21 1.040 3.15 1.008
Housing development 3.42 0.892 3.63 0.770
Waste management 3.26 1.004 3.35 0.965
Quality of water 3.63 0.886 3.59 0.889
Electric supply 3.81 0.778 3.89 0.745
Internet connectivity 3.34 1.021 3.56 0.987
Economic 3.28 3.43
Overall economic development 3.60 0.740 3.65 0.722
Economic structure (type of economic sectors) 3.50 0.769 3.63 0.785
Cost of living 3.20 0.907 3.39 0.888
Employment opportunities 3.09 0.965 3.34 0.955
Income distribution 3.16 0.883 3.26 0.918
Digital economy development 3.14 0.857 3.32 0.985
(Cont’d..)
Volume 9 Issue 2 (2023) 79 https://doi.org/10.36922/ijps.442