
Page 87 - IJPS-9-2
P. 87
International Journal of
Population Studies Development service in East Malaysia Suburban
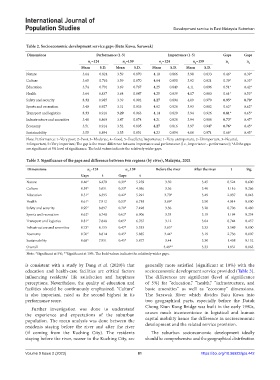
Table 2. Socioeconomic development service gaps (Batu Kawa, Sarawak)
Dimensions Performance (1‑5) Importance (1‑5) Gaps Gaps
n =124 n =159 n =124 n =159 n 1 n 2
1
2
1
2
Mean S.D. Mean S.D. Mean S.D. Mean S.D.
Nature 3.64 0.824 3.59 0.870 4.10 0.866 3.98 0.833 0.46* 0.39*
Culture 3.65 0.763 3.59 0.870 4.04 0.850 3.92 0.821 0.39* 0.33*
Education 3.74 0.791 3.69 0.767 4.25 0.849 4.11 0.896 0.51* 0.42*
Health 3.64 0.837 3.64 0.847 4.25 0.839 4.17 0.883 0.61* 0.53*
Safety and security 3.32 0.985 3.39 0.992 4.27 0.894 4.09 0.970 0.95* 0.70*
Sports and recreation 3.40 0.927 3.31 0.933 4.02 0.926 3.93 0.882 0.62* 0.62*
Transport and logistics 3.33 0.916 3.29 0.963 4.14 0.820 3.94 0.926 0.81* 0.65*
Infrastructure and amenities 3.48 0.869 3.47 0.874 4.21 0.826 3.94 0.986 0.73* 0.47*
Economy 3.51 0.914 3.52 0.805 4.27 0.816 3.97 0.947 0.76* 0.45*
Sustainability 3.55 0.894 3.55 0.851 4.23 0.854 4.00 0.971 0.68* 0.45*
Note: Performance: 1=Very poor, 2=Poor, 3=Moderate, 4=Good, 5=Excellent; Importance: 1=Very unimportant, 2=Unimportant, 3=Neutral,
4=Important, 5=Very important; The gap is the mean difference between importance and performance (i.e., importance – performance); *All the gaps
are significant at 5% level of significance. The bold values indicate the relatively wider gaps.
Table 3. Significance of the gaps and difference between two regions (by river), Malaysia, 2021
Dimensions n =124 n 159 Before the river After the river t Sig.
1 2=
Gaps t Gaps t
Nature 0.46* 6.470 0.39* 5.259 3.50 3.45 0.524 0.600
Culture 0.39* 5.651 0.33* 4.036 3.56 3.46 1.116 0.266
Education 0.51* 6.395 0.42* 5.291 3.70* 3.49 2.037 0.043
Health 0.61* 7.912 0.53* 6.718 3.89* 3.50 4.014 0.000
Safety and security 0.95* 8.897 0.70* 7.498 3.36 3.28 0.706 0.480
Sports and recreation 0.62* 6.748 0.62* 6.906 3.33 3.19 1.194 0.234
Transport and logistics 0.81* 7.848 0.65* 6.767 3.12 3.04 0.744 0.457
Infrastructure and amenities 0.73* 8.155 0.47* 5.333 3.65* 3.33 3.549 0.000
Economy 0.76* 8.814 0.45* 5.885 3.44* 3.19 2.736 0.007
Sustainability 0.68* 7.951 0.45* 5.877 3.44 3.30 1.438 0.152
Overall 3.48** 3.33 1.851 0.065
Note: *Significant at 5%; **Significant at 10%. The bold values indicate the relatively wider gaps.
is consistent with a study by Dang et al. (2020)’s that generally more satisfied (significant at 10%) with the
education and health-care facilities are critical factors socioeconomic development service provided (Table 3).
influencing residents’ life satisfaction and happiness The differences are significant (level of significance
perceptions. Nevertheless, the quality of education and of 5%) for “education,” “health,” “infrastructure, and
facilities should be continuously emphasized. “Culture” basic amenities” as well as “economy” dimensions.
is also important, rated as the second highest in its The Sarawak River which divides Batu Kawa into
performance score. two geographical parts, especially before the Datuk
Further investigation was done to understand Chong Kiun Kong Bridge was built in the early 1990s,
the experience and expectations of the suburban causes much inconvenience in logistical and human
population. The mean analysis was done between the capital mobility hence the difference in socioeconomic
residents staying before the river and after the river development and the related service provision.
(if coming from the Kuching City). The residents The suburban socioeconomic development ideally
staying before the river, nearer to the Kuching City, are should be comprehensive and the geographical distribution
Volume 9 Issue 2 (2023) 81 https://doi.org/10.36922/ijps.442