
Page 86 - IJPS-9-2
P. 86
International Journal of
Population Studies Development service in East Malaysia Suburban
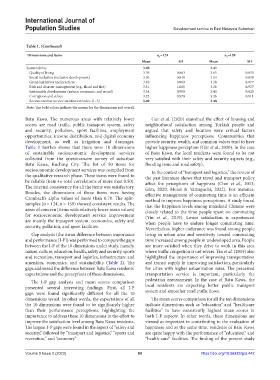
Table 1. (Continued)
Dimensions and items n =124 n =159
2
1
Mean SD Mean SD
Sustainability 3.40 3.41
Quality of living 3.59 0.863 3.65 0.853
Social inclusion (inclusive development) 3.50 0.848 3.54 0.834
Green initiatives and practices 3.40 0.909 3.28 0.977
Risk and disaster management (e.g., flood and fire) 3.31 1.065 3.28 0.937
Sustainable development (nature, economic, and social) 3.34 0.900 3.43 0.825
Corruption and ethics 3.22 0.970 3.26 0.911
Socioeconomic service satisfaction index (1–5) 3.40 3.48
Note: The bold values indicate the means for the dimensions and overall.
Batu Kawa. The numerous areas with relatively lower Gur et al. (2020) examined the effect of housing and
scores are road traffic, public transport system, safety neighborhood satisfaction among Turkish people and
and security, pollution, sport facilities, employment argued that safety and location were critical factors
opportunities, income distribution, and digital economy influencing happiness perceptions. Communities that
development, as well as irrigation and drainages. provide security, wealth, and common values tend to have
Table 1 further shows that there were 10 dimensions higher happiness perception (Gür et al., 2020). In the case
of sustainable socioeconomic development services of Batu Kawa, the local residents were found to be not
collected from the questionnaire survey of suburban very satisfied with their safety and security aspects (e.g.,
Batu Kawa, Kuching City. The list of 50 items for flooding issue and road safety).
socioeconomic development services was compiled from In the context of “transport and logistics,” the review of
the qualitative research phase. These items were found to the past literature shows that travel and transport policy
be reliable (item-to-total correlations of more than 0.50). affect the perceptions of happiness (Choi et al., 2013;
The internal consistency for all the items was satisfactory. Gim, 2020; Motoi & Yamaguchi, 2022). For instance,
Besides, the dimensions of these items were having effective management of commuting time is an efficient
Cronbach’s alpha values of more than 0.70. The split- method to improve happiness perceptions. A study found
samples (n = 124, n = 159) showed consistent results. The that the happiness levels among mainland Chinese were
areas of concern (items with relatively lower mean values) closely related to the time people spent on commuting
for socioeconomic development service improvement (Yin et al., 2019). Lower satisfaction is experienced
are mainly the transport system, economics, safety and when people have to endure longer commuting time.
security, pollution, and sport facilities. Nevertheless, higher endurance was found among people
Gap analysis (the mean difference between importance living in urban area and sensitivity toward commuting
and performance [I-P]) was performed to compare the gaps time increased among people in undeveloped area. People
between the I-P of the 10 dimensions under study, namely, are more satisfied when they drive to work in this area
nature, culture, education, health, safety and security, sports where traffic congestion is not severe. Yin et al. (2019) also
and recreation, transport and logistics, infrastructure and highlighted the importance of improving transportation
amenities, economics, and sustainability (Table 2). The and transit supply in improving satisfaction, particularly
gaps addressed the difference between Batu Kawa residents’ for cities with higher urbanization rates. The perceived
expectations and the perceptions of these dimensions. transportation service is important, particularly the
The I-P gap analysis and mean scores comparison pedestrian environment. In the case of Batu Kawa, the
presented several interesting findings. First, all I-P local residents are expecting better public transport
gaps were found significantly different for all the 10 system and smoother road traffic flows.
dimensions tested. In other words, the expectations of all The mean scores comparison for all the ten dimensions
the 10 dimensions were found to be significantly higher indicate dimensions such as “education” and “healthcare
than their performance perceptions, highlighting the facilities” to have consistently highest mean scores in
importance to address these 10 dimensions in the effort to both I-P aspects. In other words, these dimensions are
improve the satisfaction level among Batu Kawa residents. viewed as important in contributing to the evaluation of
The largest I-P gaps were found in the aspect of “safety and happiness and at the same time, residents of Batu Kawa
security,” followed by “transport and logistics,” “sports and are quite happy with the performance of “education” and
recreation,” and “economy.” “health-care” facilities. The finding of the present study
Volume 9 Issue 2 (2023) 80 https://doi.org/10.36922/ijps.442