
Page 87 - ITPS-8-2
P. 87
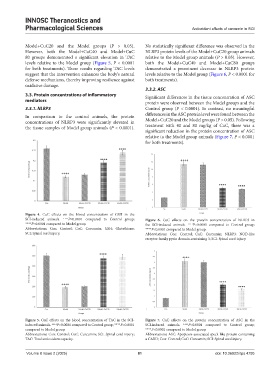
INNOSC Theranostics and
            Pharmacological Sciences                                               Antioxidant effects of curcumin in SCI


            Model+CuC20 and the Model groups (P >  0.05).      No statistically significant difference was observed in the
            However,  both  the  Model+CuC40  and  Model+CuC   NLRP3 protein levels of the Model+CuC20 group animals
            80  groups demonstrated a significant elevation in TAC   relative to the Model group animals (P > 0.05). However,
            levels relative to the Model group (Figure 5, P < 0.0001   both the Model+CuC40 and Model+CuC80 groups
            for both treatments). These results regarding TAC levels   demonstrated a prominent decrease in NLRP3 protein
            suggest that the intervention enhances the body’s natural   levels relative to the Model group (Figure 6, P < 0.0001 for
            defense mechanisms, thereby improving resilience against   both treatments).
            oxidative damage.
                                                               3.3.2. ASC
            3.3. Protein concentrations of inflammatory        Significant differences in the tissue concentration of ASC
            mediators                                          protein were observed between the Model groups and the
            3.3.1. NLRP3                                       Control group (P < 0.0001). In contrast, no meaningful
            In  comparison  to  the  control  animals,  the  protein   differences in the ASC protein level were found between the
            concentrations of NLRP3 were significantly elevated in   Model+CuC20 and the Model groups (P > 0.05). Following
            the tissue samples of Model group animals (P < 0.0001).   treatment with 40 and 80  mg/kg of CuC, there was a
                                                               significant reduction in the protein concentration of ASC
                                                               relative to the Model group animals (Figure 7, P < 0.0001
                                                               for both treatments).


            Figure  4. CuC effects on the blood concentration of GSH in the
            SCI-induced animals.   ++++ P<0.0001 compared to Control group;   Figure  6. CuC effects on the protein concentration of NLRP3 in
            ****P<0.0001 compared to Model group.              the SCI-induced animals.   ++++ P<0.0001 compared to Control group;
            Abbreviations: Con: Control; CuC: Curcumin; GSH: Glutathione;   ****P<0.0001 compared to Model group.
            SCI: Spinal cord injury.                           Abbreviations: Con: Control; CuC: Curcumin; NLRP3: NOD-like
                                                               receptor family pyrin domain-containing 3; SCI: Spinal cord injury.


            Figure 5. CuC effects on the blood concentration of TAC in the SCI-  Figure  7. CuC effects on the protein concentration of ASC in the
            induced animals.  ++++ P<0.0001 compared to Control group;****P<0.0001   SCI-induced animals.   ++++ P<0.0001 compared to Control group;

            compared to Model group.                           ****P<0.0001 compared to Model group.
            Abbreviations: Con: Control; CuC: Curcumin; SCI: Spinal cord injury;   Abbreviations: ASC: Apoptosis-associated speck-like protein containing
            TAC: Total antioxidant capacity.                   a CARD; Con: Control; CuC: Curcumin; SCI: Spinal cord injury.

             Volume 8 Issue 2 (2025)                        81                               doi: 10.36922/itps.4795