
Page 65 - JCAU-5-2
P. 65
Journal of Chinese
Architecture and Urbanism Cooling energy-saving mechanism
envelope with different performance is roughly the same.
Its distribution trend is composed of two parts. The first
part is the time when the outdoor dry bulb temperature
is between 26°C and 27°C (831 h). The behavioral energy-
saving effect brought by increasing temperature set-point
makes the hourly load reduction rate of these scatter
points all 100%, and the scatter points are distributed in
parallel. The other part is that when the outdoor dry bulb
temperature is higher than 27°C (2510 h), the hourly load
reduction rate decreases rapidly with the increase of air
conditioning load in an exponential curve, most of which
are concentrated below 20% level and form a smooth
curve. (ii) Although the hourly load reduction rate (100%)
of scattered points in the first part is higher than that of
scattered points in the second part, the latter has more Figure 9. Comparison of hourly load reduction rate based on hourly load
corresponding moments and a larger load base before variation. Source: Graph by the authors
set-point rise, which plays a controlling role in the change
trend of macro energy-saving rate. (iii) For the second part
of scattered points, the cooling load demand range narrow
results in the bigger curvature of the hourly load reduction
rate curve (that is, the more concave to the origin), that is,
the load reduction rate is smaller. From this microscopic
distribution feature, the rule above can be proven that the
monthly and annual absolute energy-saving and relative
energy-saving rates decrease with the improvement of the
thermal performance of the envelope.
5. Discussion
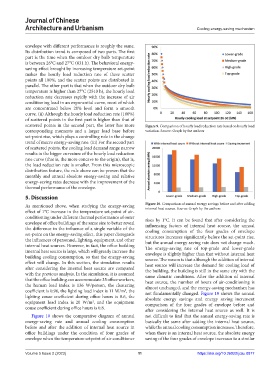
As mentioned above, when studying the energy-saving Figure 10. Comparison of annual energy savings before and after adding
internal heat source. Source: Graph by the authors
effect of 1°C increase in the temperature set-point of air-
conditioning under different thermal performance of outer rises by 1°C. It can be found that after considering the
envelope of office buildings of the same size to better reveal influencing factors of internal heat source, the annual
the difference in the influence of a single variable of the cooling consumption of the four grades of envelope
set-point on the energy-saving effect, this paper disregards structures increases significantly before the set-point rise,
the influences of personnel, lighting, equipment, and other but the annual energy saving rate does not change much.
internal heat sources. However, in fact, the office building The energy-saving rate of top-grade and lower-grade
internal heat source is large, which will greatly increase the envelope is slightly higher than that without internal heat
building cooling consumption, so that the energy-saving source. The reason is that although the addition of internal
effect will change. In this section, the simulation results heat source will increase the demand for cooling load of
after considering the internal heat source are compared the building, the building is still in the same city with the
with the previous analysis. In the simulation, it is assumed same climatic conditions. After the addition of internal
that the office building can accommodate 35 office workers, heat source, the number of hours of air-conditioning is
the human load index is 136 W/person, the clustering almost unchanged, and the energy-saving mechanism has
2
coefficient is 0.96, the lighting load index is 11 W/m , the not fundamentally changed. Figure 10 shows the annual
lighting couse coefficient during office hours is 0.6, the absolute energy savings and energy saving increment
equipment load index is 20 W/m , and the equipment comparison of the four grades of envelope before and
2
couse coefficient during office hours is 0.8. after considering the internal heat source as well. It is
Figure 10 shows the comparative diagram of annual not difficult to find that the annual energy-saving rate is
energy-saving rate and annual cooling consumption basically the same after adding the internal heat source,
before and after the addition of internal heat source in while the annual cooling consumption increases. Therefore,
office buildings under the condition of four grades of when there is an internal heat source, the absolute energy
envelope when the temperature setpoint of air conditioner saving of the four grades of envelope increases to a similar
Volume 5 Issue 2 (2023) 11 https://doi.org/10.36922/jcau.0877