
Page 64 - JCAU-5-2
P. 64
Journal of Chinese
Architecture and Urbanism Cooling energy-saving mechanism
gentle distribution near a minimum value; the other is the The worse the thermal performance of the envelope, the
linear increase with the increase of cooling load. (iii) The greater the energy savings potential of the act, and thus
load reduction with linear increase is the time when the the better the energy savings of the act of increasing the
outdoor temperature is between 26°C and 27°C. As the load temperature setting value, and finally the greater the
reduction amount at these moments is equal to the hourly absolute energy savings throughout the year. In addition,
cooling load at 26°C, the figure shows a linear growth rule. an outdoor temperature of between 26°C and 27°C is
The better the thermal performance of the envelope, the common in the transitional season of the year. From this
smaller the growth range of load reduction amount and point, it can be explained that the above monthly energy
the smaller the maximum value. (iv) The gently distributed savings obtained the maximum distribution characteristics
load reduction occurs when the outdoor temperature is in the transitional season.
>27°C. The load reduction at these moments is generated
by temperature difference heat transfer. The better the 4.2. Micro mechanism of relative energy-saving rate
thermal performance of the envelope, the smaller the range The cooling load caused by solar radiation is an important
of cooling load requirements before set-point rise, and the part of the total cooling load. Figure 8A and 8B show the
smaller the constant value of load reduction distribution, comparison of annual hourly cooling load reduction rate
and the more concentrated the distribution. with horizontal solar radiation under the envelope of
lower-grade and top-grade when temperature set-point
From the above analysis of the load reduction at the increases by 1°C. It can be seen from the diagram that:
micro level, the variation rule of the annual macro absolute For envelope with different thermal performance, as the
energy savings mainly depends on the energy-saving effect horizontal solar radiation increases, the hourly cooling
obtained by the set-point adjustment behavior at the time load reduction rate has the same variation range and
when the outdoor temperature is between 26°C and 27°C.
similar variation trend, which is the reason of the same
climatic condition. The hourly load reduction rate is 100%
for 831 h, when the outdoor temperature is in the range of
26°C – 27°C mentioned above. For other moments, hourly
load reduction rate is mainly distributed in the range of
<20%, the distribution points of top-grade envelope are
more intensive, and the hourly load reduction rate point
is lower than that of the lower-grade envelope under the
same level of solar radiation intensity. Therefore, the annual
weighted energy-saving rate of top-grade envelope is lower
(9.73%) than that of lower-grade envelope (12.44%).
Figure 9 shows the comparison of hourly load reduction
rate with the change of air-conditioning load before set-
point rise under envelope of four grades and analyzes the
energy-saving mechanism from another perspective. It can
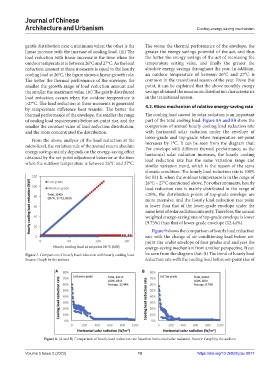
Figure 7. Comparison of hourly load reduction with hourly cooling load. be seen from the diagram that: (i) The trend of hourly load
Source: Graph by the authors reduction rate with the cooling load before set-point rise of
A B
Figure 8. (A and B) Comparison of hourly load reduction rate based on horizontal solar radiation. Source: Graph by the authors
Volume 5 Issue 2 (2023) 10 https://doi.org/10.36922/jcau.0877