
Page 61 - JCAU-5-2
P. 61
Journal of Chinese
Architecture and Urbanism Cooling energy-saving mechanism
all ages. The mechanism affecting energy savings is very energy savings in hot months (May–October) and a smaller
complicated, which will be analyzed from the microscopic impact in cool months (January, February, and December).
dimension of hours in the paper. This is reflected in the fact that the absolute energy savings
decreases more in hot months than in cooler months as
3.2. Monthly energy saving the performance of the envelope improves. (iii) With the
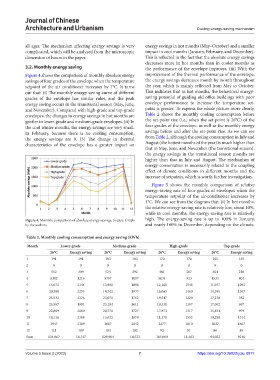
Figure 4 shows the comparison of monthly absolute energy improvement of the thermal performance of the envelope,
savings of four grades of the envelope when the temperature the energy savings decreases month by month throughout
setpoint of the air conditioner increases by 1°C. It turns the year, which is mainly reflected from May to October.
out that: (i) The monthly energy saving curve of different This indicates that in hot months, the behavioral energy-
grades of the envelope has similar rules, and the peak saving potential of guiding old office buildings with poor
energy saving occurs in the transitional season (May, June, envelope performance to increase the temperature set-
and November). Compared with high-grade and top-grade point is greater. To express the whole picture more clearly,
envelopes, the changes in energy savings in hot months are Table 2 shows the monthly cooling consumption before
gentler in lower-grade and medium-grade envelopes. (ii) In the set-point rise (i.e., when the set-point is 26°C) of the
the cool winter months, the energy savings are very small. four grades of the envelope, as well as the monthly energy
In February, because there is no cooling consumption, savings before and after the set-point rise. As we can see
the energy savings are 0. (3) The change in thermal from Table 2, although the cooling consumption in July and
characteristics of the envelope has a greater impact on August (the hottest months of the year) is much higher than
that in May, June, and November (the transitional season),
the energy savings in the transitional season months are
higher than that in July and August. The mechanism of
energy conservation is necessarily related to the coupling
effect of climate conditions in different months and the
increase of setpoints, which is worth further investigation.
Figure 5 shows the monthly comparison of relative
energy-saving rate of four grades of envelopes when the
temperature setpoint of the air-conditioner increases by
1°C. We can see from the diagram that: (i) In hot months,
the relative energy-saving rate is relatively low, about 10%,
while in cool months, the energy-saving rate is relatively
Figure 4. Monthly comparison of absolute energy savings. Source: Graph high. The energy-saving rate is up to 100% in January,
by the authors and nearly 100% in December, depending on the climate.
Table 2. Monthly cooling consumption and energy saving (kWh)
Month Lower‑grade Medium‑grade High‑grade Top‑grade
26°C Energy saving 26°C Energy saving 26°C Energy saving 26°C Energy saving
1 191 191 183 183 170 170 165 165
2 0 0 0 0 0 0 0 0
3 552 309 524 292 481 267 464 256
4 6302 1216 5797 1097 5034 923 4534 801
5 15,072 2144 13,901 1896 12,161 1546 11,077 1292
6 20,388 2255 18,742 1933 16,065 1460 14,395 1107
7 25,532 2176 23,070 1762 19,547 1220 17,150 782
8 25,587 1991 23,104 1611 19,531 1107 17,002 697
9 22,869 2060 20,770 1727 17,873 1317 15,831 979
10 14,116 2108 13,022 1879 11,370 1552 10,290 1314
11 3947 2189 3687 2042 3277 1810 3027 1667
12 111 109 104 102 92 91 86 85
Sum 134,667 16,747 129,904 14,523 105,600 11,463 94,022 9146
Volume 5 Issue 2 (2023) 7 https://doi.org/10.36922/jcau.0877