
Page 98 - JCAU-5-2
P. 98
Journal of Chinese
Architecture and Urbanism Study on ecosystem service value in Wuhan
2. Materials and methods Multi-temporal data are needed for the ESV assessment of
dynamic analysis.
2.1. Research area
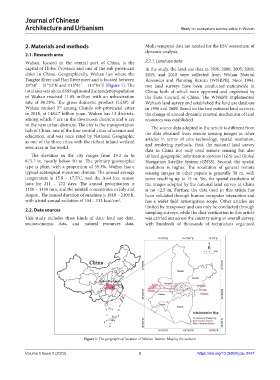
Wuhan, located in the central part of China, is the 2.2.1. Land use data
capital of Hubei Province and one of the sub-provincial In the study, the land-use data in 1996, 2000, 2005, 2010,
cities in China. Geographically, Wuhan lies where the 2015, and 2018 were collected from Wuhan Natural
Yangtze River and Han River meet and is located between Resources and Planning Bureau (WNRPB). Since 1984,
29°58’ – 31°22’N and 113°41’ – 115°05’E (Figure 1). The two land surveys have been conducted nationwide in
total area was about 8569 sqkmand the resident population China; both of which were approved and organized by
of Wuhan reached 11.08 million with an urbanization the State Council of China. The WNRPB implemented
rate of 80.29%. The gross domestic product (GDP) of Wuhan’s land survey and established the land use database
rd
Wuhan ranked 3 among China’s sub-provincial cities in 1996 and 2009. Based on the two national land surveys,
in 2018, at 1484.7 billion yuan. Wuhan has 13 districts, the change of annual dynamic renewal mechanism of land
among which 7 are in the downtown districts and 6 are resources was established.
in the new urban districts. The city is the transportation The source data adopted in the article is different from
hub of China, one of the four central cities of science and the data obtained from remote sensing images in other
education, and was once rated by National Geographic articles in terms of core technology, spatial resolution,
as one of the three cities with the richest inland wetland and rendering methods. First, the national land survey
resources in the world.
data in China not only used remote sensing but also
The elevation in the city ranges from 19.2 m to utilized geographic information systems (GIS) and Global
873.7 m, mostly below 50 m. The primary geomorphic Navigation Satellite System (GNSS). Second, the spatial
type is plain, with a proportion of 39.3%. Wuhan has a resolution is higher. The resolution of general remote
typical subtropical monsoon climate. The annual average sensing images in other papers is generally 30 m, with
temperature is 15.8 – 17.5°C, and the frost-free season some reaching up to 15 m. Yet, the spatial resolution of
lasts for 211 – 272 days. The annual precipitation is the images adopted by the national land survey in China
1150 – 1450 mm, and the rainfall concentrates in July and is no <2.5 m. Further, the data used in this article has
August. The annual duration of sunshine is 1810 – 2100 h, been validated through human-computer interaction and
with a total annual radiation of 104 – 113 kcal/cm . has a wider field investigation scope. Other articles are
2
limited by manpower and can only be conducted through
2.2. Data sources sampling surveys, while the data verification in this article
This study includes three kinds of data: land use data, was carried out across the country using an overall survey,
socioeconomic data, and natural resources data. with hundreds of thousands of technicians organized
Figure 1. The geographical location of Wuhan. Source: Map by the authors
Volume 5 Issue 2 (2023) 3 https://doi.org/10.36922/jcau.0427