
Page 66 - JCAU-5-4
P. 66
Journal of Chinese
Architecture and Urbanism Housing satisfaction with apartments in Henan
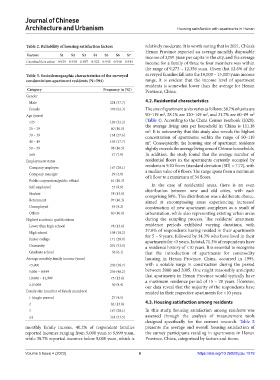
Table 2. Reliability of housing satisfaction factors relatively moderate. It is worth noting that in 2021, China’s
Henan Province reported an average monthly disposable
Factors S1 S2 S3 S4 S5 S6 S7 income of 3,091 yuan per capita in the city, and the average
Cronbach’s α value 0.929 0.918 0.897 0.925 0.945 0.948 0.914 income for a family of three to four members was within
the range of 9,273 – 12,356 yuan. Given that 12.6% of the
Table 3. Sociodemographic characteristics of the surveyed surveyed families fall into the 10,000 – 15,000 yuan income
condominium apartment residents (N=594) range, it is evident that the income level of apartment
residents is somewhat lower than the average for Henan
Category Frequency (n [%]) Province, China.
Gender
Male 224 (37.7) 4.2. Residential characteristics
Female 370 (62.3) The size of apartment units varies as follows: 38.7% of units are
2
2
2
Age (years) 90–119 m , 28.1% are 120–149 m , and 21.7% are 60–89 m
<25 120 (22.2) (Table 4). According to the China Census Yearbook (2020),
25 – 29 60 (10.1) the average living area per household in China is 111.18
m . It is noteworthy that this study also reveals the highest
2
30 – 39 164 (27.6) concentration of apartments within the range of 90–119
40 – 49 105 (17.7) m . Consequently, the housing size of apartment residents
2
50 – 59 98 (16.5) slightly exceeds the average living area of Chinese households.
≥60 47 (7.9) In addition, the study found that the average number of
Employment status residential floors in the apartments currently occupied by
Company employee 167 (28.1) residents is 9.20 floors (standard deviation [SD] = 7.72), with
a median value of 6 floors. The range spans from a minimum
Company manager 29 (4.9) of 1 floor to a maximum of 34 floors.
Public corporation/public official 61 (10.3)
In the case of residential areas, there is an even
Self-employed 53 (8.9) distribution between new and old cities, with each
Student 78 (13.1)
comprising 50%. This distribution was a deliberate choice,
Retirement 97 (16.3) aimed at encompassing areas experiencing increased
Unemployed 49 (8.2) construction of new apartment complexes as a result of
Others 60 (10.1) urbanization, while also representing existing urban areas
Highest academic qualifications during the sampling process. The residents’ apartment
Lower than high school 78 (13.1) residence periods exhibited varying durations, with
High school 108 (18.2) 37.0% of respondents having resided in their apartments
for 5 – 9 years, followed by 34.3% who have lived in their
Junior college 171 (28.8) apartments for <5 years. In total, 71.3% of respondents have
University 201 (33.8) a residence history of <10 years. It is essential to recognize
Graduate school 36 (6.1) that the introduction of apartments for commodity
Average monthly family income (yuan) housing in Henan Province, China, occurred in 1995,
<5,000 230 (38.7) with a notable surge in construction during the period
5,000 – 9,999 239 (40.2) between 2000 and 2005. One might reasonably anticipate
10,000 – 14,999 75 (12.6) that apartments in Henan Province would typically have
a maximum residence period of 15 – 20 years. However,
≥15,000 50 (8.4) our data reveal that the majority of the respondents have
Family size (number of family members) resided in their respective apartments for <10 years.
1 (single person) 27 (4.5)
4.3. Housing satisfaction among residents
2 82 (13.8)
3 167 (28.1) In this study, housing satisfaction among residents was
≥4 318 (53.5) assessed through the analysis of measurement tools
designed specifically for the current research. Table 5
monthly family income, 40.2% of respondent families presents the average and overall housing satisfaction of
reported incomes ranging from 5,000 yuan to 9,999 yuan, the survey participants residing in apartments in Henan
while 38.7% reported incomes below 5,000 yuan, which is Province, China, categorized by factors and items.
Volume 5 Issue 4 (2023) 6 https://doi.org/10.36922/jcau.1079