
Page 68 - JCAU-5-4
P. 68
Journal of Chinese
Architecture and Urbanism Housing satisfaction with apartments in Henan
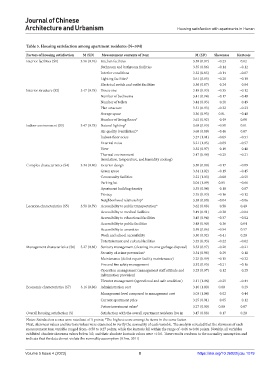
Table 5. Housing satisfaction among apartment residents (N=594)
Factors of housing satisfaction M (SD) Measurement contents of item M (SD) Skewness Kurtosis
Interior facilities (S1) 3.56 (0.76) Kitchen facilities 3.58 (0.87) −0.23 0.02
Bathroom and bathroom facilities 3.55 (0.86) −0.14 −0.12
Interior conditions 3.52 (0.85) −0.14 −0.07
Lighting facilities* 3.61 (0.85) −0.20 −0.18
Electrical switch and outlet facilities 3.56 (0.87) −0.24 −0.04
Interior structure (S2) 3.47 (0.78) House size 3.48 (0.93) −0.35 −0.12
Number of bedrooms 3.41 (0.94) −0.17 −0.49
Number of toilets 3.44 (0.93) −0.20 −0.49
Plan structure 3.51 (0.93) −0.32 −0.23
Storage space 3.36 (0.93) 0.01 −0.48
Number of living floors* 3.61 (0.92) −0.49 0.08
Indoor environment (S3) 3.47 (0.78) Natural lighting* 3.68 (0.93) −0.50 0.01
Air quality (ventilation)* 3.68 (0.89) −0.46 0.07
Indoor-floor noise 3.27 (1.01) −0.09 −0.51
External noise 3.21 (1.05) −0.09 −0.57
View 3.52 (0.97) −0.19 −0.48
Thermal environment 3.47 (0.94) −0.25 −0.21
(insulation, temperature, and humidity cooling)
Complex characteristics (S4) 3.34 (0.80) Exterior design 3.50 (0.89) −0.17 −0.09
Green space 3.34 (1.02) −0.19 −0.45
Community facilities 3.23 (1.03) −0.08 −0.55
Parking lot 3.04 (1.09) 0.05 −0.66
Apartment building density 3.35 (0.94) −0.18 −0.07
Privacy 3.35 (0.93) −0.16 −0.12
Neighborhood relationship* 3.59 (0.80) −0.04 −0.06
Location characteristics (S5) 3.50 (0.79) Accessibility to public transportation* 3.62 (0.88) −0.58 0.49
Accessibility to medical facilities 3.49 (0.91) −0.38 −0.04
Accessibility to educational facilities 3.45 (0.94) −0.37 −0.02
Accessibility to public facilities 3.48 (0.90) −0.36 0.04
Accessibility to amenities 3.59 (0.86) −0.54 0.57
Work and school accessibility 3.50 (0.92) −0.41 0.20
Entertainment and cultural facilities 3.35 (0.93) −0.22 −0.02
Management characteristics (S6) 3.27 (0.88) Sanitary management (cleaning income garbage disposal) 3.33 (0.97) −0.20 −0.21
Security of crime prevention* 3.34 (0.98) −0.29 −0.18
Maintenance (defect repair facility maintenance) 3.25 (0.99) −0.15 −0.32
Fire and fire safety management 3.32 (0.95) −0.21 −0.16
Operation management (management staff attitude and 3.25 (0.97) −0.12 −0.25
information provision)
Elevator management (operational and safe condition) 3.11 (1.08) −0.25 −0.44
Economic characteristics (S7) 3.16 (0.86) Administration cost 3.10 (1.00) 0.00 −0.29
Management level compared to management cost 3.03 (1.04) −0.02 −0.44
Current apartment price 3.25 (0.91) −0.05 −0.12
Future investment value* 3.27 (0.90) 0.00 0.07
Overall housing satisfaction (S) Satisfaction with the overall apartment residents live in 3.47 (0.88) −0.17 0.20
Notes: Satisfaction scores were rated out of 5 points; *The highest score among the items in the same factor.
Next, skewness values and kurtosis values were examined to verify the normality of each variable. The analysis revealed that the skewness of each
measurement item variable ranged from -0.58 to 0.27 points, while the kurtosis fell within the range of -0.66 to 0.60 points. Notably, all variables
exhibited absolute skewness values below 3.0, and their absolute kurtosis values were <10.0. These results conform to the normality assumption and
indicate that the data do not violate the normality assumption (Kline, 2011)
Volume 5 Issue 4 (2023) 8 https://doi.org/10.36922/jcau.1079