
Page 72 - JCAU-5-4
P. 72
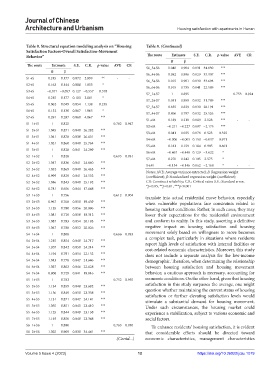
Journal of Chinese
            Architecture and Urbanism                                       Housing satisfaction with apartments in Henan


            Table 8. Structural equation modeling analysis on “Housing   Table 8. (Continued)
            Satisfaction Factors‑Overall Satisfaction‑Movement
            Behavior”                                           The route  Estimate  S.E.  C.R.  p‑value  AVE  CR
                                                                          B    β
             The route  Estimate  S.E.  C.R.  p‑value  AVE  CR  S6_3←S6  1.040  0.904 0.031 34.030  ***
                       B    β
                                                               S6_4←S6   0.982  0.896 0.029 33.307  ***
            S1→S      0.215  0.177 0.072 2.999  **  -   -
                                                               S6_5←S6   1.015  0.901 0.030 33.698  ***
            S2→S      0.163  0.144 0.088 1.853  *              S6_6←S6   0.918  0.735 0.041 22.589  ***
            S3→S     −0.071 −0.057 0.127 −0.557  0.578
                                                               S7_1←S7    1   0.895                 0.753 0.924
            S4→S      0.215  0.177 0.103 2.081  *
                                                               S7_2←S7   1.031  0.889 0.032 31.789  ***
            S5→S      0.062  0.049 0.054 1.138  0.255
                                                               S7_3←S7   0.855  0.839 0.030 28.191  ***
            S6→S      0.132  0.130 0.067 1.965  *
                                                               S7_4←S7   0.806  0.797 0.032 25.526  ***
            S7→S      0.291  0.297 0.060 4.867  ***
                                                               S1→M      0.189  0.210 0.089 2.128  ***  -  -
            S1_1←S1    1   0.825                 0.782 0.947
                                                               S2→M     −0.211 −0.227 0.097 −2.175  ***
            S1_2←S1   1.045  0.871 0.040 26.282  ***
                                                               S3→M      0.041  0.035 0.078 0.523  0.325
            S1_3←S1   1.041  0.878 0.039 26.631  ***
                                                               S4→M     −0.006 −0.005 0.150 −0.037  0.971
            S1_4←S1   1.021  0.860 0.040 25.764  ***
                                                               S5→M      0.181  0.159 0.184 0.985  0.601
            S1_5←S1    1   0.828 0.041 24.299  ***
                                                               S6→M     −0.467 −0.448 0.129 −3.622  *
            S2_1←S2    1   0.828                 0.695 0.931   S7→M      0.270  0.242 0.105 2.575  *
            S2_2←S2   1.017  0.836 0.041 24.860  ***
                                                               S→M      −0.134 −0.146 0.062 −2.168  *  -   -
            S2_3←S2   1.052  0.869 0.040 26.463  ***
                                                               Notes: AVE: Average variance extracted; B: Regression weight
            S2_4←S2   0.999  0.829 0.041 24.532  ***           (coefficient); ß: Standardized regression weight (coefficient);
            S2_5←S2   1.016  0.843 0.040 25.192  ***           CR: Construct reliability; C.R.: Critical ratio; S.E.: Standard error;
                                                               *p<0.05, **p<0.01, ***p<0.001
            S2_6←S2   0.781  0.656 0.044 17.648  ***
            S3_1←S3    1   0.756                 0.612 0.904
                                                               translate into actual residential move behavior, especially
            S3_2←S3   0.967  0.768 0.050 19.459  ***           when vulnerable populations face constraints related to
            S3_3←S3   1.135  0.790 0.056 20.096  ***           housing market conditions. Rather, in such cases, they may
            S3_4←S3   1.081  0.729 0.059 18.312  ***           lower their expectations for the residential environment
            S3_5←S3   1.087  0.793 0.054 20.193  ***           and conform to reality. In this study, asserting a definitive
            S3_6←S3   1.047  0.788 0.052 20.026  ***           negative impact on housing satisfaction and housing
            S4_1←S4    1   0.808                 0.666 0.933   movement solely based on willingness to move becomes
            S4_2←S4   1.215  0.854 0.049 24.717  ***           a  complex  task,  particularly  in  situations  where  residents
                                                               report high levels of satisfaction with internal facilities or
            S4_3←S4   1.207  0.842 0.050 24.214  ***           cost-related economic characteristics. Moreover, this study
            S4_4←S4   1.194  0.791 0.054 22.152  ***           does not  include  a  separate analysis  for  the  low-income
            S4_5←S4   1.013  0.778 0.047 21.646  ***           demographic. Therefore, when determining the relationship
            S4_6←S4   1.037  0.803 0.046 22.628  ***           between  housing  satisfaction  and  housing  movement
            S4_7←S4   0.808  0.729 0.041 19.816  ***           behavior, a cautious approach is necessary, accounting for
            S5_1←S5    1   0.782                 0.752 0.955   economic conditions. On the other hand, given that housing
                                                               satisfaction in this study surpasses the average, one might
            S5_2←S5   1.134  0.859 0.048 23.682  ***
            S5_3←S5   1.156  0.849 0.050 23.338  ***           question whether maintaining the current status of housing
                                                               satisfaction or  further elevating satisfaction levels would
            S5_4←S5   1.131  0.871 0.047 24.141  ***           stimulate a substantial demand for housing movement.
            S5_5←S5   1.055  0.851 0.045 23.410  ***           Under such circumstances, the housing market could
            S5_6←S5   1.125  0.844 0.049 23.138  ***           experience a stabilization, subject to various economic and
            S5_7←S5   1.149  0.850 0.049 23.348  ***           social factors.
            S6_1←S6    1   0.890                 0.763 0.950     To enhance residents’ housing satisfaction, it is evident
            S6_2←S6   1.025  0.909 0.030 34.441  ***           that considerable efforts should be directed toward
                                                   (Contd...)  economic characteristics, management characteristics


            Volume 5 Issue 4 (2023)                         12                       https://doi.org/10.36922/jcau.1079