
Page 70 - JCAU-5-4
P. 70
Journal of Chinese
Architecture and Urbanism Housing satisfaction with apartments in Henan
indicated that residents categorized under “employment Table 7. Differences in housing satisfaction according to
status – other” reported the lowest overall housing satisfaction housing characteristics of residents’ apartments
(M = 3.15). Retirees receiving pensions also expressed Variables n Overall housing satisfaction
relatively lower levels of satisfaction (M = 3.35), while those
Standard
associated with public corporations/public officials exhibited Mean deviation t/F
the highest levels of satisfaction (M = 3.70). It is worth noting 2
that white-collar workers, unemployed individuals, students, House size (m ) F=8.50***
and those holding company management positions reported <60 29 3.03 a 0.98
notably high levels of satisfaction. As for “Average monthly 60 – 89 129 3.25 ab 0.87
family income,” it was revealed that variations in overall 90 – 119 230 3.44 bc 0.86
housing satisfaction existed between income classes below 120 – 149 167 3.69 cd 0.85
and above 10,000 yuan.
≥150 39 3.82 d 0.68
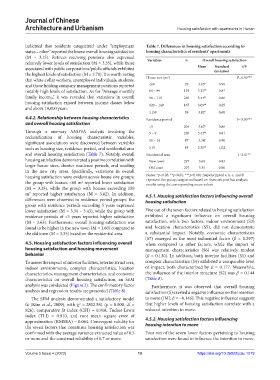
4.4.2. Relationship between housing characteristics Residence period F=3.50***
and overall housing satisfaction
<5 204 3.63 b 0.86
Through a one-way ANOVA analysis involving the 5 – 9 220 3.43 ab 0.81
reclassification of housing characteristic variables, a
significant associations were discovered between variables 10 – 14 87 3.34 0.90
such as housing size, residence period, and residential area ≥15 83 3.35 ab 1.02
and overall housing satisfaction (Table 7). Notably, overall Residential area t=3.41**
housing satisfaction demonstrated a positive correlation with New town 297 3.60 0.83
larger house sizes, shorter residence periods, and residing Old town 297 3.35 0.90
in the new city areas. Specifically, variations in overall
housing satisfaction were evident across house size groups; Notes: *p<0.05, **p<0.01, ***p<0.001; Superscripted a, b, c, and d
the group with houses <60 m reported lower satisfaction represent the group categorized based on Duncan’s post hoc analysis
2
results using the corresponding mean values
(M = 3.25), while the group with houses exceeding 150
m reported higher satisfaction (M = 3.82). In addition, 4.5.1. Housing satisfaction factors influencing overall
2
differences were observed in residence period groups; the housing satisfaction
group with residence periods exceeding 5 years expressed
lower satisfaction (M = 3.34 – 3.43), while the group with Five out of the seven factors related to housing satisfaction
residence periods of <5 years reported higher satisfaction exhibited a significant influence on overall housing
(M = 3.63). Furthermore, overall housing satisfaction was satisfaction, while two factors, indoor environment (S3)
found to be higher in the new town (M = 3.60) compared to and location characteristics (S5), did not demonstrate
the old town (M = 3.35) based on the residential area. a substantial impact. Notably, economic characteristics
(S7) emerged as the most influential factor (β = 0.297)
4.5. Housing satisfaction factors influencing overall when compared to other factors, while the impact of
housing satisfaction and housing movement management characteristics (S6) was relatively modest
behavior (β = 0.130). In addition, both interior facilities (S1) and
To assess the impact of interior facilities, interior structures, complex characteristics (S4) exhibited a comparable level
indoor environments, complex characteristics, location of impact, both characterized by β = 0.177. Meanwhile,
characteristics, management characteristics, and economic the influence of the interior structure (S2) was β = 0.144
characteristics on overall housing satisfaction, an SEM (Table 8).
analysis was conducted (Figure 2). The confirmatory factor Furthermore, it was observed that overall housing
analysis and regression results are presented (Table 8). satisfaction (S) exerted a negative influence on the intention
The SEM analysis demonstrated a satisfactory model to move ([M], β = −0.146). This negative influence suggests
fit (Kim et al., 2009), with χ = 2802.581 (p = 0.000, df = that higher levels of housing satisfaction correlate with a
2
826), comparative fit index (CFI) = 0.918, Tucker-Lewis reduced intention to move.
index (TLI) = 0.910, and root mean square error of 4.5.2. Housing satisfaction factors influencing
approximation (RMSEA) = 0.064. Convergent validity for housing intention to move
the seven factors that constitute housing satisfaction was
confirmed with the average variance extracted value of 0.5 Four out of the seven lower factors pertaining to housing
or more and the construct reliability of 0.7 or more. satisfaction were found to influence the intention to move,
Volume 5 Issue 4 (2023) 10 https://doi.org/10.36922/jcau.1079