
Page 68 - JCAU-7-1
P. 68
Journal of Chinese
Architecture and Urbanism Non-equilibrium territorial space use in PRD
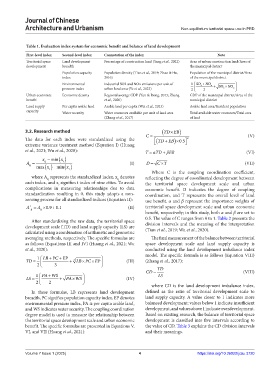
Table 1. Evaluation index system for economic benefit and balance of land development
First‑level index Second‑level index Connotation of the index Note
Territorial space Land development Percentage of construction land (Yang et al., 2022) Area of urban construction land/Area of
development breadth the municipal district
Population capacity Population density (Tian et al., 2019; Zhao & Hu, Population of the municipal district/Area
index 2016) of the municipal district
Environmental Industrial SO2 and NOx emissions per unit of 1 SO 2 NO x SO
pressure index urban land area (Ye et al., 2023) 2 2 2 NO
x
Urban economic Economic density Regional average GDP (Yun & Dong, 2013; Zhang GDP of the municipal district/Area of the
benefit et al., 2020) municipal district
Land supply Per capita arable land Arable land per capita (Wei et al., 2023) Arable land area/Resident population
capacity Water security Water resources available per unit of land area Total available water resources/Total area
(Zhang et al., 2017) of land
3.2. Research method TD EB
C (V)
The data for each index were standardized using the TD EB05. 2
extreme variance treatment method (Equation I) (Huang
et al., 2021; Wu et al., 2020): T = αTD + βEB (VI)
x min x
A max ij x min i x (I) D C T (VII)
ij
i
i
Where C is the coupling coordination coefficient,
where A represents the standardized index, x denotes reflecting the degree of coordinated development between
ij
ij
each index, and x signifies i index of nine cities. To avoid the territorial space development scale and urban
i
complications in measuring relationships due to data economic benefit. D indicates the degree of coupling
standardization resulting in 0, this study adopts a non- coordination, and T represents the overall level of land
zeroing process for all standardized indices (Equation II): use benefit. α and β represent the importance weights of
.
.
A’ A 09 01 (II) territorial space development scale and urban economic
ij
ij
benefit, respectively; in this study, both α and β are set to
0.5. The value of C ranges from 0 to 1. Table 2 presents the
After standardizing the raw data, the territorial space
development scale (TD) and land supply capacity (LS) are division intervals and the meaning of the interpretation
calculated using a combination of arithmetic and geometric (Tian et al., 2019; Wu et al., 2020).
averaging methods, respectively. The specific formulas are The final measurement of the balance between territorial
as follows (Equations III and IV) (Huang et al., 2021; Wu space development scale and land supply capacity is
et al., 2020): conducted using the land development imbalance index
model. The specific formula is as follows (Equation VIII)
1 LB PC EP
TD 3 LB PC EP (III) (Zhang et al., 2017):
2 3
CD = TD (VIII)
1 PA WS LS
LS PA WS (IV)
2 2 where CD is the land development imbalance index,
In these formulas, LB represents land development defined as the ratio of territorial development scale to
breadth, PC signifies population capacity index, EP denotes land supply capacity. A value closer to 1 indicates more
environmental pressure index, PA is per capita arable land, balanced development; values below 1 indicate insufficient
and WS indicates water security. The coupling coordination development, and values above 1 indicate overdevelopment.
degree model is used to measure the relationship between Based on existing research, the balance of territorial space
the territorial space development scale and urban economic development is classified into five intervals according to
benefit. The specific formulas are presented in Equations V, the value of CD. Table 3 explains the CD division intervals
VI, and VII (Huang et al., 2021): and their meanings.
Volume 7 Issue 1 (2025) 4 https://doi.org/10.36922/jcau.3720