
Page 70 - JCAU-7-1
P. 70
Journal of Chinese
Architecture and Urbanism Non-equilibrium territorial space use in PRD
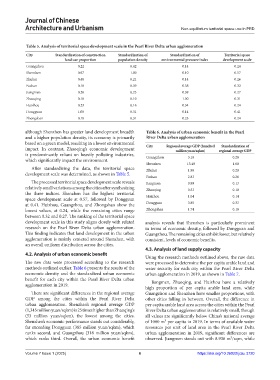
Table 5. Analysis of territorial space development scale in the Pearl River Delta urban agglomeration
City Standardization of construction Standardization of Standardization of Territorial space
land use proportion population density environmental pressure index development scale
Guangzhou 0.22 0.42 0.14 0.24
Shenzhen 0.97 1.00 0.10 0.57
Zhuhai 0.48 0.21 0.14 0.26
Foshan 0.10 0.39 0.58 0.32
Jiangmen 0.20 0.23 0.39 0.27
Zhaoqing 0.10 0.10 1.00 0.31
Huizhou 0.23 0.16 0.34 0.24
Dongguan 1.00 0.31 0.14 0.41
Zhongshan 0.18 0.31 0.23 0.24
although Shenzhen has greater land development breadth Table 6. Analysis of urban economic benefit in the Pearl
and a higher population density, its economy is primarily River Delta urban agglomeration
based on a green model, resulting in a lower environmental City Regional average GDP (hundred Standardization of
impact. In contrast, Zhaoqing’s economic development million yuan/sqkm) regional average GDP
is predominantly reliant on heavily polluting industries, Guangzhou 3.18 0.28
which significantly impact the environment.
Shenzhen 13.48 1.00
After standardizing the data, the territorial space Zhuhai 1.98 0.20
development scale was determined, as shown in Table 5.
Foshan 2.83 0.26
The processed territorial space development scale reveals Jiangmen 0.99 0.13
relatively small variations among the cities after synthesizing Zhaoqing 0.53 0.10
the three indices. Shenzhen has the highest territorial
space development scale at 0.57, followed by Dongguan Huizhou 1.04 0.14
at 0.41. Huizhou, Guangzhou, and Zhongshan show the Dongguan 3.85 0.33
lowest values, at 0.24, while the remaining cities range Zhongshan 1.74 0.18
between 0.32 and 0.27. The ranking of the territorial space
development scale in this study aligns closely with related analysis reveals that Shenzhen is particularly prominent
research on the Pearl River Delta urban agglomeration. in terms of economic density, followed by Dongguan and
This finding indicates that land development in the urban Guangzhou. The remaining cities exhibit lower, but relatively
agglomeration is mainly centered around Shenzhen, with consistent, levels of economic benefits.
an overall uniform distribution across the cities.
4.3. Analysis of land supply capacity
4.2. Analysis of urban economic benefit
Using the research methods outlined above, the raw data
The raw data were processed according to the research were processed to determine the per capita arable land and
methods outlined earlier. Table 6 presents the results of the water security for each city within the Pearl River Delta
economic density and the standardized urban economic urban agglomeration in 2019, as shown in Table 7.
benefit for each city within the Pearl River Delta urban Jiangmen, Zhaoqing, and Huizhou have a relatively
agglomeration in 2019.
high proportion of per capita arable land area, while
There are significant differences in the regional average Guangzhou and Shenzhen have smaller proportions, with
GDP among the cities within the Pearl River Delta other cities falling in between. Overall, the difference in
urban agglomeration. Shenzhen’s regional average GDP per capita arable land area across the cities within the Pearl
(1,345 million yuan/sqkm) is 25 times higher than Zhaoqing’s River Delta urban agglomeration is relatively small, though
(53 million yuan/sqkm), the lowest among the cities. all values are significantly below China’s national average
Shenzhen’s economic performance stands out considerably, of 1000 m³ per capita in 2019. In terms of available water
far exceeding Dongguan (385 million yuan/sqkm), which resources per unit of land area in the Pearl River Delta
ranks second, and Guangzhou (318 million yuan/sqkm), urban agglomeration in 2019, significant differences are
which ranks third. Overall, the urban economic benefit observed. Jiangmen stands out with 8.936 m³/sqm, while
Volume 7 Issue 1 (2025) 6 https://doi.org/10.36922/jcau.3720