
Page 69 - JCAU-7-1
P. 69
Journal of Chinese
Architecture and Urbanism Non-equilibrium territorial space use in PRD
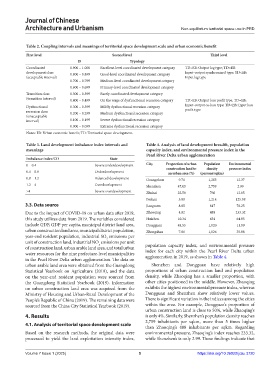
Table 2. Coupling intervals and meanings of territorial space development scale and urban economic benefit
First level Second level Third level
D Typology
Coordinated 0.900 – 1.000 Excellent-level coordinated development category TD>EB: Output lag type; TD=EB:
development class 0.800 – 0.899 Good-level coordinated development category Input-output synchronized type; TD<EB:
(acceptable interval) Input lag type
0.700 – 0.799 Medium-level coordinated development category
0.600 – 0.699 Primary-level coordinated development category
Transition class 0.500 – 0.599 Barely coordinated development category
(transition interval) 0.400 – 0.499 On the verge of dysfunctional recession category TD>EB: Output loss profit type; TD=EB:
Dysfunctional 0.300 – 0.399 Mildly dysfunctional recession category Input-output co-loss type; TD<EB: Input loss
recession class 0.200 – 0.299 Medium dysfunctional recession category profit type
(unacceptable
interval) 0.100 – 0.199 Severe dysfunctional recession category
0.000 – 0.099 Extreme dysfunctional recession category
Notes: EB: Urban economic benefit; TD: Territorial space development.
Table 3. Land development imbalance index intervals and Table 4. Analysis of land development breadth, population
meanings capacity index, and environmental pressure index in the
Pearl River Delta urban agglomeration
Imbalance index/CD State
0 – 0.4 Severe underdevelopment City Proportion of urban Population Environmental
construction land to density pressure index
0.4 – 0.8 Underdevelopment an urban area (%) (persons/sqkm)
0.8 – 1.2 Balanced development Guangzhou 9.71 1,283 12.37
1.2 – 4 Overdevelopment Shenzhen 47.05 2,759 2.99
>4 Severe overdevelopment Zhuhai 22.50 766 12.05
Foshan 3.80 1,214 125.08
3.3. Data source Jiangmen 8.85 817 78.25
Due to the impact of COVID-19 on urban data after 2019, Zhaoqing 4.02 488 233.32
this study utilizes data from 2019. The variables considered Huizhou 10.34 634 64.85
include GDP, GDP per capita, municipal district land area, Dongguan 48.55 1,020 11.99
urban construction land area, municipal district population, Zhongshan 7.86 1,026 35.88
year-end resident population, industrial SO emissions per
2
unit of construction land, industrial NO emissions per unit
x
of construction land, urban arable land area, and total urban population capacity index, and environmental pressure
water resources for the nine prefecture-level municipalities index for each city within the Pearl River Delta urban
in the Pearl River Delta urban agglomeration. The data on agglomeration in 2019, as shown in Table 4.
urban arable land area were obtained from the Guangdong Shenzhen and Dongguan have relatively high
Statistical Yearbook on Agriculture (2019), and the data proportions of urban construction land and population
on the year-end resident population were sourced from density, while Zhaoqing has a smaller proportion, with
the Guangdong Statistical Yearbook (2019). Information other cities positioned in the middle. However, Zhaoqing
on urban construction land area was acquired from the exhibits the highest environmental pressure index, whereas
Ministry of Housing and Urban-Rural Development of the Dongguan and Shenzhen show relatively lower values.
People’s Republic of China (2019). The remaining data were There is significant variation in the indices among the cities
sourced from the China City Statistical Yearbook (2019). within the area. For example, Dongguan’s proportion of
urban construction land is close to 50%, while Zhaoqing’s
4. Results is only 4%. Similarly, Shenzhen’s population density reaches
2,759 inhabitants per sqkm, more than 5 times higher
4.1. Analysis of territorial space development scale
than Zhaoqing’s 488 inhabitants per sqkm. Regarding
Based on the research methods, the original data were environmental pressure, Zhaoqing’s index reaches 233.32,
processed to yield the land exploitation intensity index, while Shenzhen’s is only 2.99. These findings indicate that
Volume 7 Issue 1 (2025) 5 https://doi.org/10.36922/jcau.3720