
Page 139 - JCAU-7-2
P. 139
Journal of Chinese
Architecture and Urbanism Urban features of PRD in online image
the Bing search engine. Corresponding images and text by dense buildings or light, rural landscapes characterized
titles associated with these towns were synchronously by open countryside.
downloaded. During the data collection process, it was To achieve this, town images were assembled into a 10×10
observed that the top 100 images of each central town, grid using Photoshop software, creating a set of images
along with their associated text content, were sufficient to downloaded sequentially from a search engine (Figure 3).
capture the imageability of the towns. Therefore, these top The brightness levels of each town’s images were examined
100 images and their corresponding text were selected as using Photoshop’s histogram function, and the standard
the study’s research materials. deviation of brightness values was calculated to compare
However, some central towns had fewer than 100 images the differences between urban and rural landscapes across
available for download, suggesting a lower level of public towns (Table 1). By arranging the mean brightness values
interest or search activity on the internet. These towns in descending order, it was found that the central towns
were excluded from the study. Ultimately, 81 central towns of Huizhou, Zhaoqing, and Foshan ranked highest. These
with more than downloadable images were included as the towns displayed brighter and lighter imagery, dominated by
research objects of this study. The image sources included scenes featuring open skies and water, reflecting expansive
enterprise portals, such as the Paper (https://m.thepaper. and bright rural landscapes. Conversely, Guangzhou
cn/newsDetail_forward_7153747) and travel websites exhibited the lowest average brightness values, indicating a
such as Qunar (https://travel.qunar.com/p-pl6077281). predominance of darker urban imagery.
The accompanying text was extracted from the titles of the The standard deviation analysis revealed that Dongguan
pages where the images were located. and Huizhou had the highest values, both exceeding 5.
After data cleaning, sorting, and storage, each central This finding suggests significant variation between urban
town’s dataset consisted of the top 100 images and their and rural landscapes in these areas, with each exhibiting
corresponding texts. This step resulted in a total of 8,100 distinctive representative scenes. The imagery strongly
valid images and over 510,000 characters of segmented highlights the recognizability of both urban and rural
text. Using the Tencent Cloud AI image recognition model, environments. For instance, in Machong town of
which intelligently analyzes the content proportions Dongguan city (Figure 2), the first 100 images collected
within images, image labels for the research materials featured not only densely constructed urban landscapes but
were obtained through Python-based API calls. The high- also extensive farmlands and waterways, demonstrating a
proportion image labels were organized, resulting in the pronounced trend of urban–rural integration. In contrast,
identification of more than 20,000 image tags in total. the spatial scenes of the central towns in five cities, including
Zhaoqing and Guangzhou, exhibit characteristics of partial
4. Empirical findings ruralization or partial urbanization.
4.1. Overall analysis of network image 4.1.2. Analysis of high-frequency words in texts
4.1.1. Clarity analysis of overall images in each town associated with each town
The present study distinguishes the overall imagery of By analyzing the present values of text word frequency,
each town by analyzing the brightness histograms of a public image network formed by high-frequency word
image matrices. The aim is to identify whether the images pairs in central towns was constructed. The research first
predominantly feature dark, urban landscapes dominated established a planning corpus focused on small towns.
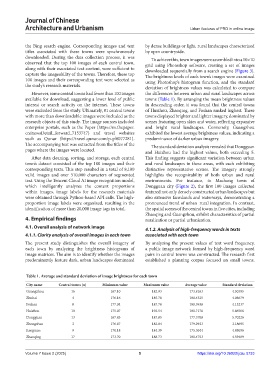
Table 1. Average and standard deviation of image brightness for each town
City name Central towns (n) Minimum value Maximum value Average value Standard deviation
Guangzhou 16 167.10 182.93 173.8163 4.50395
Zhuhai 4 176.16 185.78 180.4525 4.04679
Foshan 8 177.04 187.78 180.5938 4.13237
Huizhou 10 175.07 192.54 181.7170 5.66506
Dongguan 13 167.45 187.85 177.3708 5.70226
Zhongshan 3 176.67 182.84 179.2933 3.18695
Jiangmen 9 170.18 184.39 175.3044 4.44096
Zhaoqing 17 173.70 188.73 181.4753 4.59489
Volume 7 Issue 2 (2025) 5 https://doi.org/10.36922/jcau.5733