
Page 91 - JCAU-7-2
P. 91
Journal of Chinese
Architecture and Urbanism Computational urbanism on Dashilar
hutongs as a conceptual starting point to explore the (iii) Impact of public facilities: How do public facilities,
significant crises and challenges associated with Beijing’s such as public toilets, influence the evolution of the
rapid urbanization (Figure 1). entire hutong fabric?
Over the course of a 5-year study, we aimed to challenge Throughout the study, we address the dynamic
conventional design approaches and identify the dynamic factors influencing urban development and aim to create
factors shaping and influencing urban development, a fluid, circular urban system shaped by these factors.
including economic growth, environmental considerations, Digital technology plays a crucial role in orchestrating
and population mobility and migration. Cities, as intricate, dynamically interactive urban environments
continuously evolving systems, differ significantly from the within existing urban landscapes. Utilizing digital tools,
broader natural environment (Verebes, 2013). Rejecting we generate and manage these dynamic models to better
the notion of cities as static and unchanging entities, we understand these interactions (Ball, 2001) (Figure 3).
propose that cities grow, change, and evolve (Verebes, 2009)
in response to a variety of influencing factors (Figure 2). 2.1. Urban traffic force field
Cities evolve and transform through the interplay of
2. Methods various forces within a dynamic force field, encompassing
The present study investigates how transitions in urban factors such as terrain, road traffic, and program layout.
programs, population shifts, changes in family structures, Transportation operates within a specific transportation
and evolving neighborhood relations internally drive field; the field’s strength reflects not only the volume of
urbanization, manage the impact of social factors, and commuting on different roads but also the convenience
enable the development of digital models for prototype of transportation and the potential noise hazards across
analysis. The study primarily focuses on three key areas various regions (Jagutis et al., 2023). Furthermore, changes
(Alexander et al., 1977): within the transportation field are influenced by the
(i) Neighborhood dynamics: How modifications within hierarchical structure of roads, their spatial organization,
courtyard houses and changing neighborhood and fluctuations in population density (Figure 4).
relations foster new communication models and 2.2. Grid system
spatial connections. Could these changes lead to novel
forms of spatial agglomeration? A city’s grid system serves as the foundational framework
(ii) Adaptive use of hutongs: How do hutongs, as an for its development. A robust urban grid system must
embodiment of modern life, adapt to evolving living adapt to changes in program distribution rather than
demands and diverse activities by revamping their remain rigid and static. As program distributions evolve,
programs? land values naturally shift. A dynamic grid system that
actively responds to these changes in land value aligns more
effectively with the current state of urban development.
In this context, the outcomes of program distribution
are conceptualized as point force fields, which influence
a predetermined homogeneous spatial grid system.
This approach allows the grid’s configuration to evolve
dynamically in response to shifts in both program
distribution and land value (Figure 5).
2.3. Local discretization
Through the integration of program distribution and the
grid system, optimal building volumes, and spatial divisions
of roads are achieved, establishing the fundamental form
of building volumes. However, while various programs
occupy space densely, the overall program distribution
often exhibits significant variations in density. At the micro
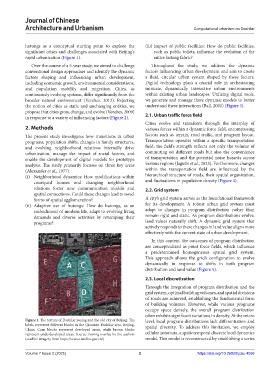
Figure 1. The texture of Dashilar zoning and the old city of Beijing. The level, local program distributions lack differentiation and
labels represent different blocks in the Qianmen Dashilar area, Beijing, spatial diversity. To address this limitation, we employ
China. Cyan blocks represent developed areas, while brown blocks
represent underdeveloped areas. Source: Zoning overlay by the authors cellular automata, a spatiotemporal discrete local dynamics
(satellite imagery from https://www.tianditu.gov.cn/) model. This model is reconstructed by establishing a series
Volume 7 Issue 2 (2025) 2 https://doi.org/10.36922/jcau.4056