
Page 86 - JCAU-7-2
P. 86
Journal of Chinese
Architecture and Urbanism Spatial network analysis of hutongs
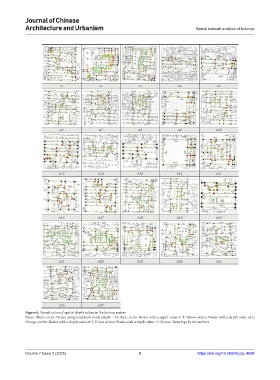
Figure 6. Visualization of spatial depth values in the hutong system
Notes: Black circles: Nodes along landmark roads (depth = 0); Red circles: Nodes with a depth value of 1; Yellow circles: Nodes with a depth value of 2;
Orange circles: Nodes with a depth value of 3; Green circles: Nodes with a depth value >3. Source: Drawings by the authors
Volume 7 Issue 2 (2025) 9 https://doi.org/10.36922/jcau.4608