Page 83 - JCAU-7-2
P. 83

Journal of Chinese
            Architecture and Urbanism                                               Spatial network analysis of hutongs


                                                               Table 2. Matrix representation of the spatial network
                                                               Node no.      0         1        2         3
                                                               0              0        1         1       9999
                                                               1              1        0       9999       1
                                                               2              1       9999       0        1
                                                               3            9999       1         1        0

                                                               Table 3. Depth values between nodes

                                                               Node no.                             Depth value
                                                               0 – 1                                    1
            Figure 3. Spatial network of urban road system. Notes:    represents
            analyzed region;    represents link;    represents node. Source:   0 – 2                    1
            Drawing by the authors                             0 – 3                                    2
                                                               1 – 2                                    2
                                                               1 – 3                                    1
                                                               2 – 3                                    1


                                                                  the depth to Node 3 is 2.
                                                               •   The depth value between Nodes 1 and 2 is 2, and the
                                                                  depth from Node 1 to Node 3 is 1.
                                                               •   The depth between Nodes 2 and 3 is 1.
                                                               The specific results are presented in Table 3.
                                                               (ii)  The minimum spatial depth between each node in
                                                                  the hutong area and landmark roads was determined.
                                                                  As illustrated in Figure 4, each red node corresponds
                                                                  to 18 black nodes, each representing a unique spatial
                                                                  depth value. The smallest of these values was selected
                                                                  as the spatial depth value for each red node relative to
                                                                  the landmark road.
                                                                (iii) Using the minimum spatial depth values, the number of
                                                                  nodes within each area that fall within a spatial depth of
                                                                  three steps or fewer was counted. To visualize the results,
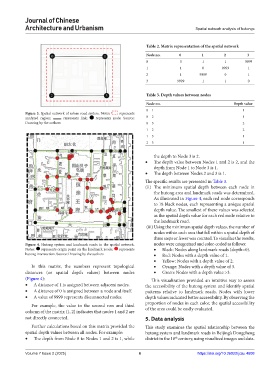
            Figure  4. Hutong system and landmark roads in the spatial network.   nodes were categorized and color-coded as follows:
            Notes:    represents origin point on the landmark roads;    represents   •   Black: Nodes along landmark roads (depth=0).
            hutong intersection. Source: Drawing by the authors   •   Red: Nodes with a depth value of 1.
                                                                  •   Yellow: Nodes with a depth value of 2.
              In this matrix, the numbers represent topological   •   Orange: Nodes with a depth value of 3.
            distances  (or spatial  depth values)  between nodes   •   Green: Nodes with a depth value >3.
            (Figure 4):                                          This visualization provided an intuitive way to assess
            •   A distance of 1 is assigned between adjacent nodes.   the accessibility of the hutong system and identify spatial
            •   A distance of 0 is assigned between a node and itself.  patterns relative to landmark roads. Nodes with lower
            •   A value of 9999 represents disconnected nodes.  depth values indicated better accessibility. By observing the
                                                               proportion of nodes in each color, the spatial accessibility
              For  example,  the  value  in  the  second  row  and  third   of the area could be easily evaluated.
            column of the matrix (1, 2) indicates that nodes 1 and 2 are
            not directly connected.                            5. Data analysis
              Further calculations based on this matrix provided the   This study examines the spatial relationship between the
            spatial depth values between all nodes. For example:  hutong system and landmark roads in Beijing’s Dongcheng
            •   The depth from Node 0 to Nodes 1 and 2 is 1, while   district in the 18  century, using visualized images and data.
                                                                            th

            Volume 7 Issue 2 (2025)                         6                        https://doi.org/10.36922/jcau.4608
   78   79   80   81   82   83   84   85   86   87   88